Machine learning for economists
Recently, Hal Varian had this to say about machine learning:
I believe that these methods have a lot to offer and should be more widely known and used by economists. In fact, my standard advice to graduate students these days is: go to the computer science department and take a class in machine learning.
So what’s machine learning? Machine learning (ML) is a sub-field of computer science concerned with algorithms that ‘learn’ from data. The basic goal of ML is to enable computers to make good predictions or decisions on the basis of observed data, with minimal reliance on humans.
So what does all this have to do with economics? Well ML is also closely related to statistics. In fact, a large branch of ML (supervised learning) is concerned with regression problems. Another part of ML (reinforcement learning) is concerned with optimal behavior in stochastic environments. Two things economists are very interested in.
ML evolved from the broader field of Artificial Intelligence (AI). However, the focus of ML is on more narrow sub-problems, in particular:
- Supervised learning: (non-parametric regression) \(y=f(X)\)
- Unsupervised learning: (clustering, dimensionality reduction) \(X\) data only, typically a ‘pre-processing’ step to Supervised or Reinforcement learning
- Reinforcement learning: (Approximate dynamic programming) solving Markov Decision Processes, with unknown transition and payoff functions
ML is often conflated with data mining. While Data mining is related to ML, the focus is more on unstructured / exploratory data analysis. Similar to unsupervised learning, data mining is more of a pre-processing step.
Machine learning in action
Machine learning is everywhere. These days you can’t really exist on-line without being exposed to machine learning algorithms whether its facebook, google or whatever. Whenever an app or a web site does something that seems a little too ‘clever’ or too like ‘magic’ its probably machine learning.
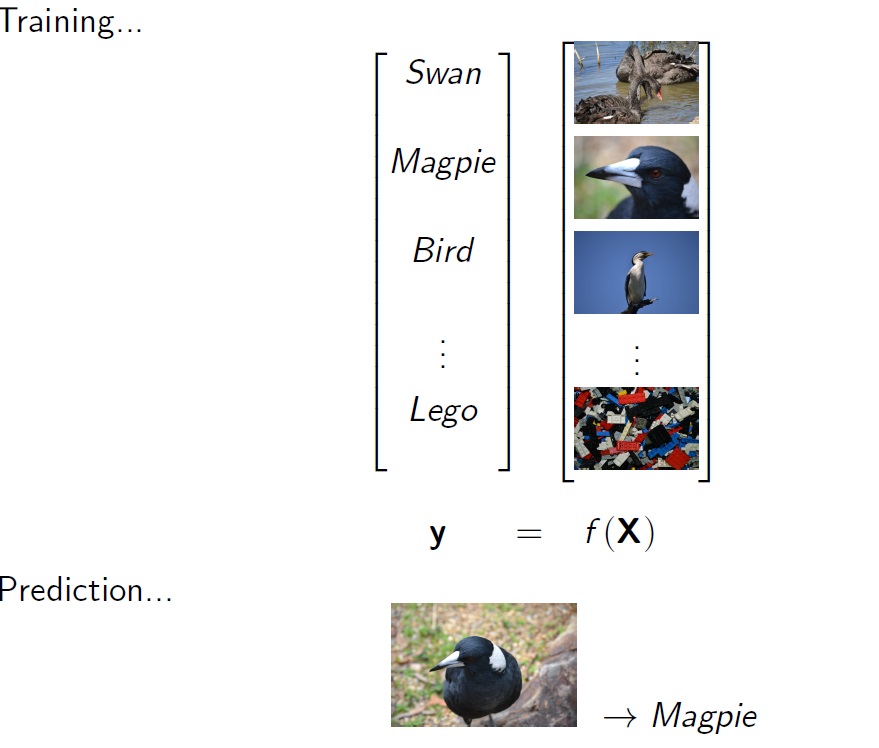
A good example of ML is computer vision and a good example of computer vision is google photos. Lying behind the google photos are some high end ML algorithms that can ‘see’ the content in photos. You upload some photos off your camera (with no identifying text or file names) and google photos can tell what’s in them: allowing you to search your library:


So how do you get a computer to see images. While the algorithm is rather complicated, the basic idea is simple: its just a big regression problem. You start with a very large database of images each with descriptive labels (provided by a human). This is called the training data: an \(X\) matrix containing photo data (pixel by pixel) and a vector \(y\) containing the labels. With ML you use the training data to fit a function \(f\) mapping from \(X\) to \(y\). Once you have \(f\) you can then use it to predict the contents of other unlabeled images.
Supervised learning versus econometrics
Leo Breiman’s 2001 article “Statistical modelling: the two cultures” contrasts modern ML methods with traditional statistics. Some view Leo’s distinction as a bit artificial - in the sense that many analysts combine methods from both schools (the term ‘Data Science’ is often used to describe a broader field that combines all statistical methods old and new).
However, this distinction remains relatively accurate when it comes to applied econometrics. In practice, supervised learning is a very different approach to regression than that used by applied econometricians. You will struggle to find any under or postgraduate courses in economics or econometrics that teach ML methods, and you will find very few applications of ML in applied econometric journals.
Econometrics
In econometrics we typically begin by inventing a parametric statistical model, often a linear model like this:
\[Y_t = \beta_0 + \beta_1 X_{1t} + \beta_2 X_{2t} + ... + \beta_n X_{nt} + e_t\] \[e_t \sim N(0, \sigma^2)\]Once we have a model we can estimate the parameters by optimisation (e.g., Ordinary Least Squares regression).
Of course the problem is how do you pick the right model?. While economic theory can provide us with some idea of which variables will be related and in what direction, it generally can’t provide an exact parametric form. As such, econometricians tend to just ‘make it up’. Invariably the model will be wrong: its just a matter of how much. Often, a range of competing models will be invented. Model selection is then performed largely on the basis of in-sample fit (using measures like \(R^2\), or the AIC for example).
With econometrics the focus is on inference: what evidence does the data provide to support our theoretical model, what are the signs of our estimated parameters and are they ‘statistically significant’.
Supervised learning
With supervised learning we start only with a general prediction problem: we want some function \(f\) which can predict variable \(y\) given some vector of variables \(X\).
\[y = f(X)\]With supervised learning we assume no knowledge of the form of \(f\). Instead, we employ ‘non-parametric’ regression methods to develop an estimate for \(f\). However, the differences between ML and econometrics are larger than parametric vs non-parametric regression methods.
With supervised learning the focus is on prediction. What we care about is can our model \(f\) can provide accurate out-of-sample predictions for \(y\) (given \(X\) data outside of our ‘training set’). Here there is limited interest in the effect of specific \(X\) variables on \(y\). Depending on the method employed our \(f\) function may remain something of a ‘black-box’.
Unlike econometrics, model selection is typically performed using out-of sample testing - also known as ‘Cross-Validation’. Here the model is fit to a subsample of the data (the training set) and its performance assessed on the withheld (test set) data.
While the focus is very different, there are many economic problems readily amenable to applications of ML. Before going any further, lets consider a simple example (the Python code for this example is available here).
A simple example
Imagine you have a regression problem with a single \(X\) and single \(y\) variable and your data looks something like this:
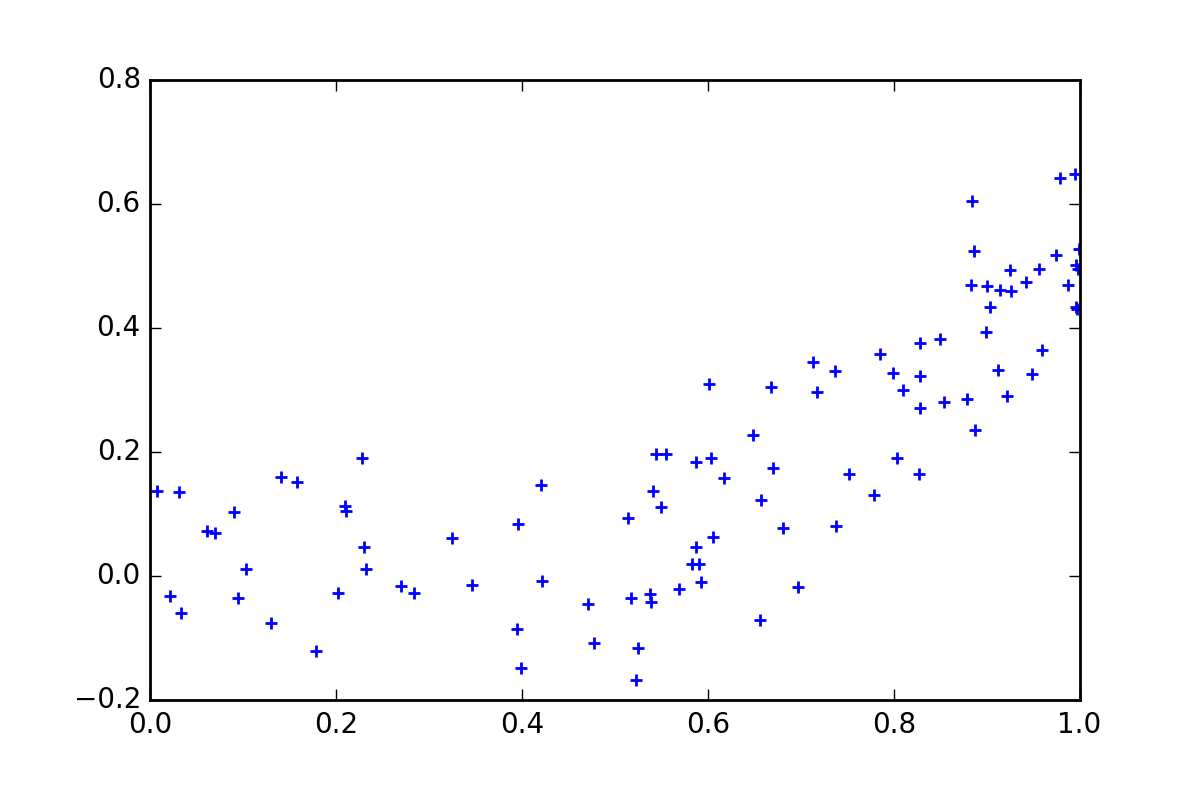
Now as an intelligent human, you can can probably already detect that the ‘true’ model is a linear spline with a single kink. To be precise, the data generating process is:
\[Y_t = max (X_t - 0.5, 0) + \epsilon_t\] \[\epsilon \sim N(0, 0.1)\] \[X \sim U(0, 1)\]But lets assume that we don’t know the true model (Remember that we are typically dealing with higher dimensional problems where it is not possible or practical for a human to eye-ball the data and determine the relationships).
OLS
If we assume instead that we have a linear model, and fit it by OLS, we get model like this.
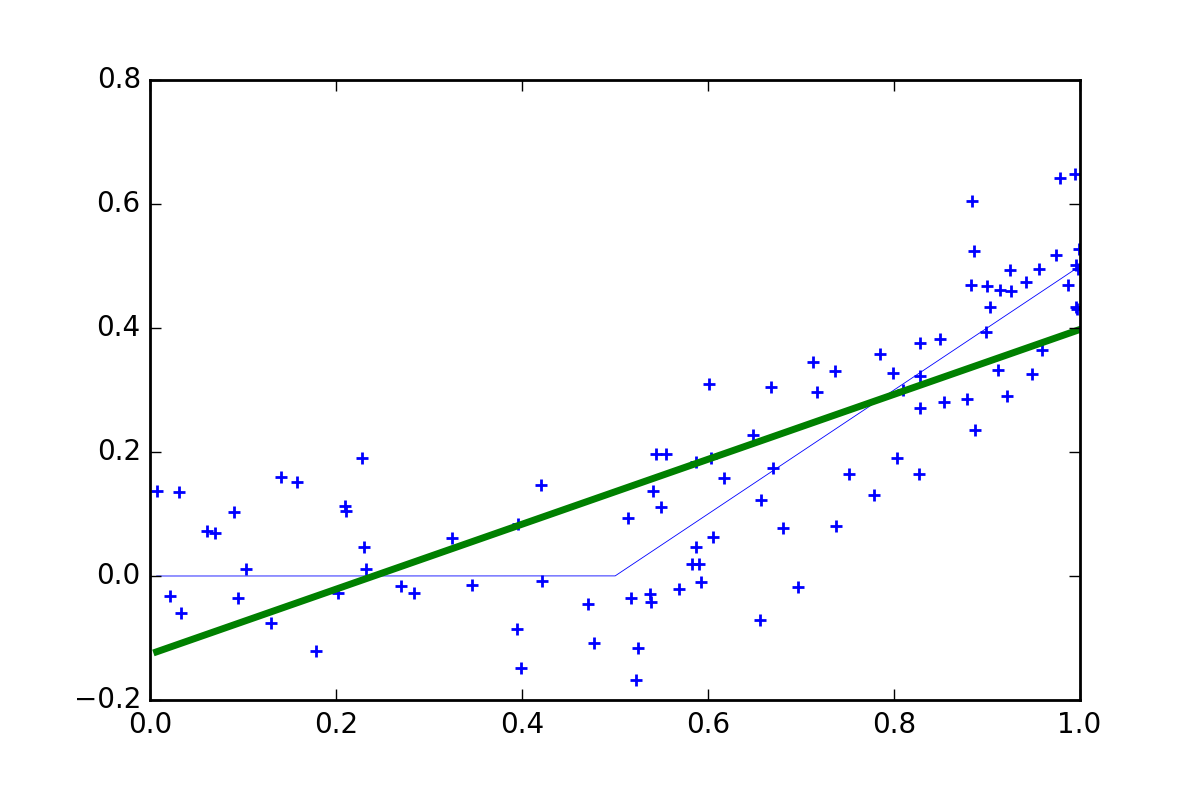
Now in terms of prediction this model performs poorly, giving correct predictions at only two points and over or underestimating everywhere else. The model is not useless, it tells us that \(X\) generally has a positive relationship with \(y\), but it fails to explain that there is no-relationship for \(X < 0.5\).
Of course if we knew the true model, we could fit that by OLS. In this case OLS would be unbeatable (i.e., BLUE - Best Linear Unbiased Estimator).
Non-parametric
But what if we don’t know the model. Well we could try a very simple non-parametric regression method known as a ‘regress-o-gram’: just divide the \(X\) space into bins and average the \(y\) points located in each. (of course actual ML algorithms are much more sophisticated than this, but I’ll leave that for another post)
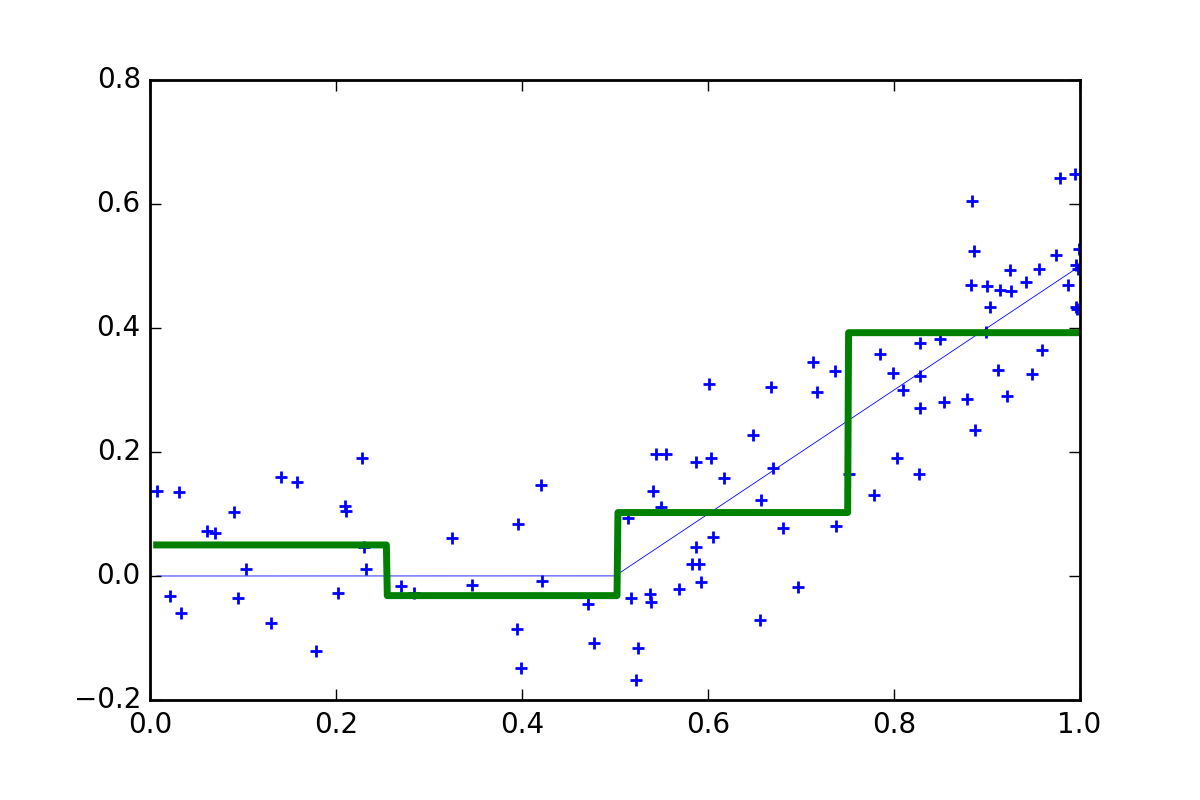
OK, so this model is still fairly poor. The function is way too ‘chunky’ (i.e., the bins are two wide) so we have a lot of bias. Well, what if we make the bins smaller:
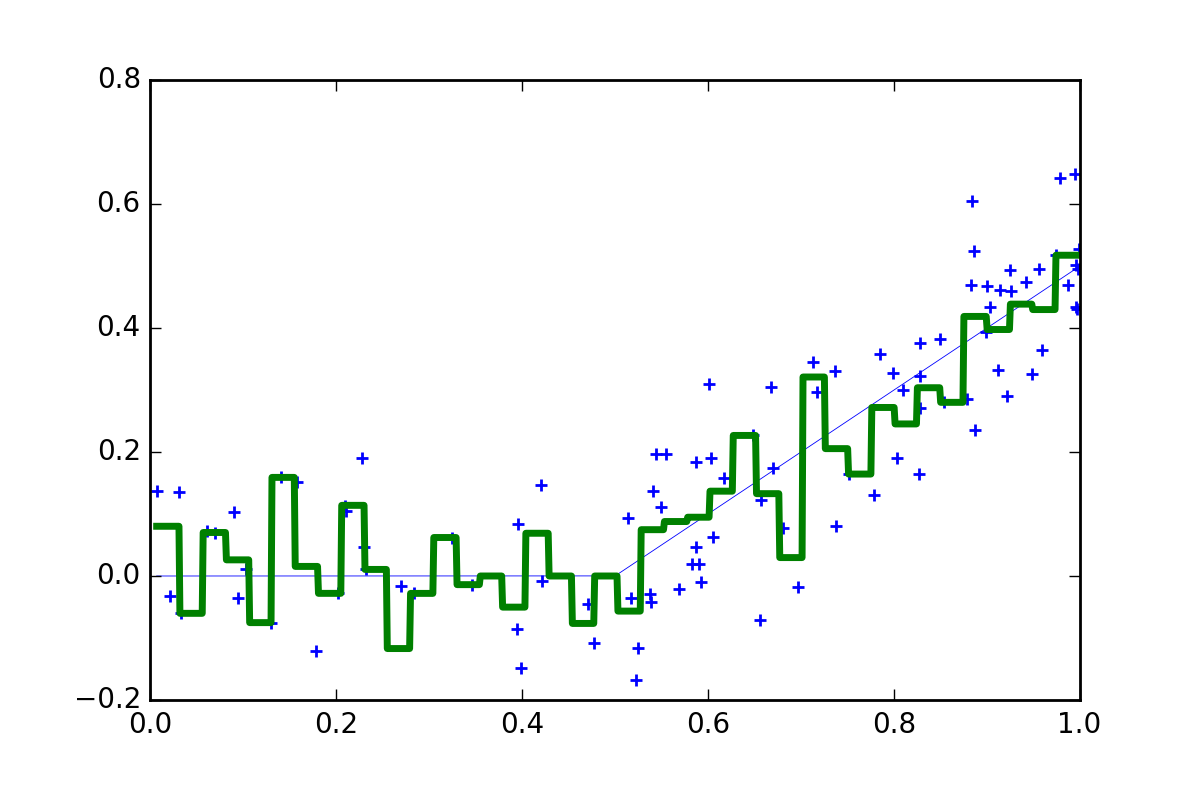
mmmm, not much better. Now the bins are too small and the function is bouncing around all over the place. In this case there are not enough data points within each bin so the resulting model has too much noise.
OK, so lets think about this more carefully. What if we try a range of bin widths and find our what works best. Below are the results for 1 to 30 bins. In each, case we record the in-sample fit \(R^2\) and given we know the true DGP we can also measure the out-of-sample fit.
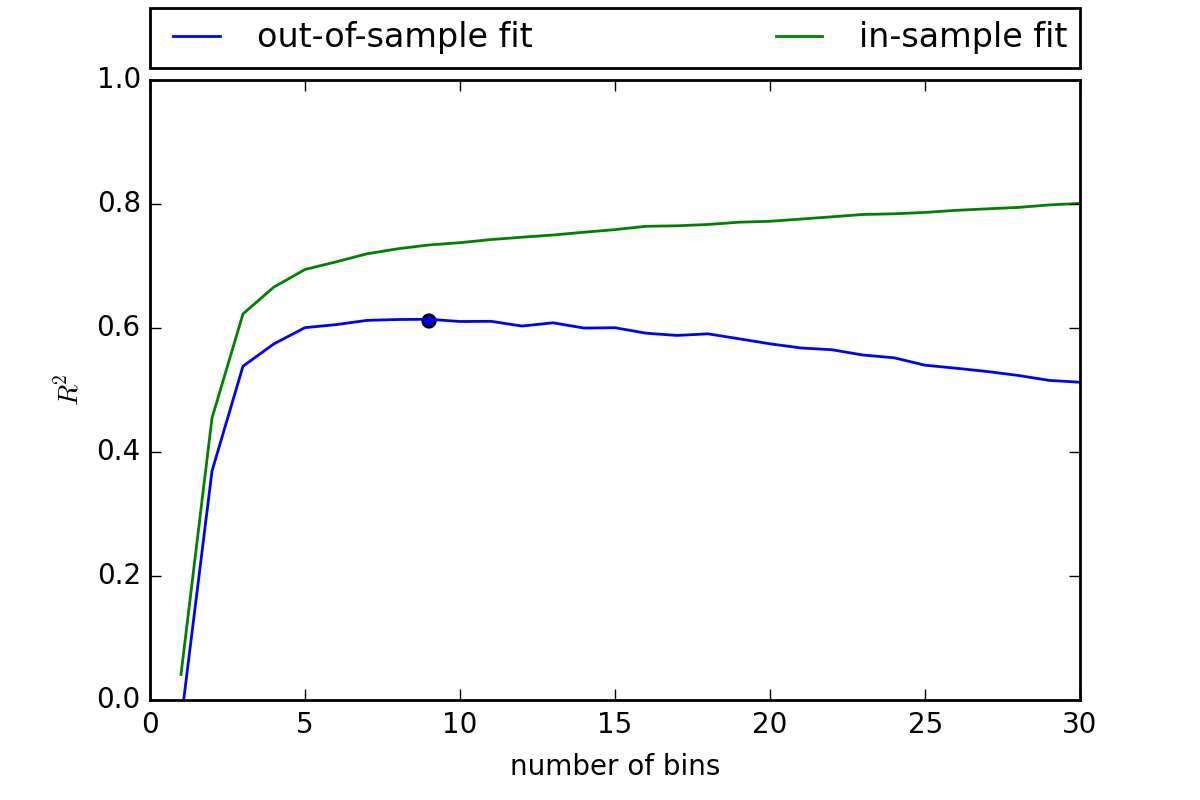
It turns out the optimal number of bins is around 9. This example demonstrates a fundamental concept in ML (and in statistics for that matter) the noise-bias trade-off. As we increase the number of bins our in-sample fit always improves. Eventually we will have as a single bin for each data point and an \(R^2\) of 1.
However, as we do this we start getting further away from the true model, a problem known as overfitting the data. The optimal model involves a ‘Goldilocks’ level of generalization (i.e., bin width) which strikes a balance between noise and bias.
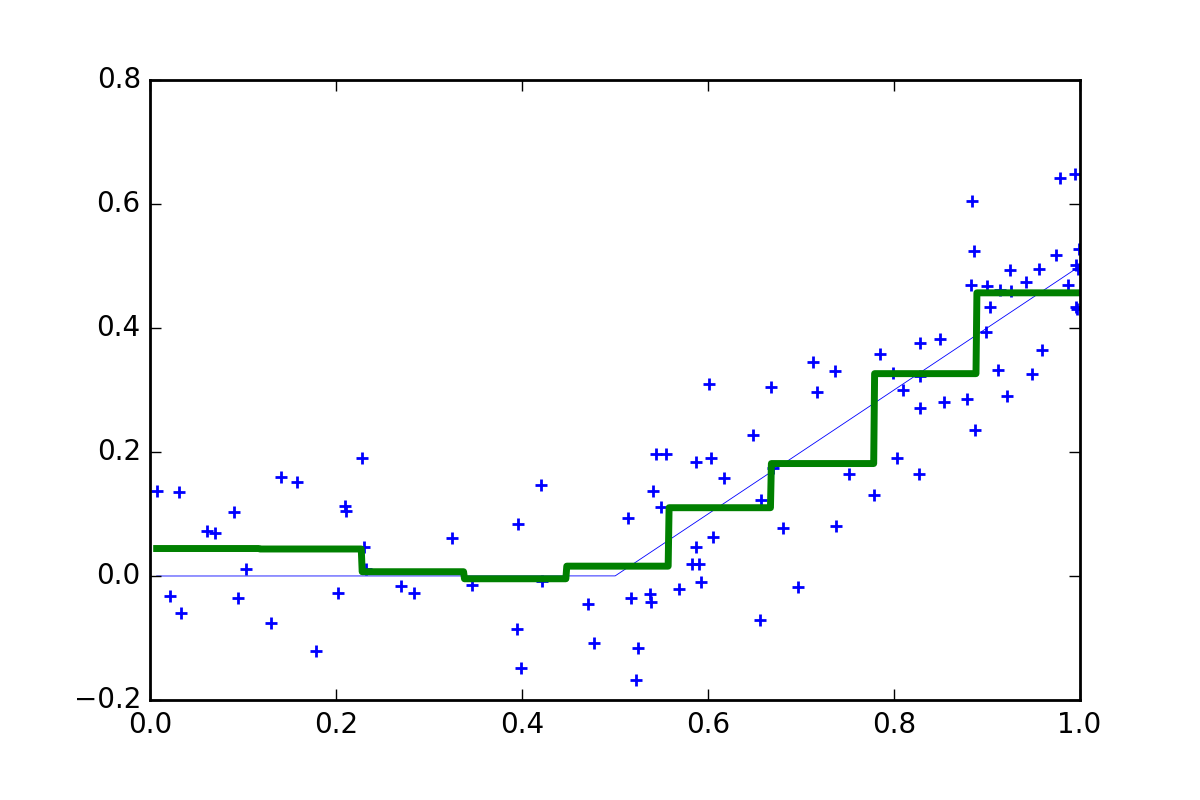
Now a model with 9 bins provides a better prediction.
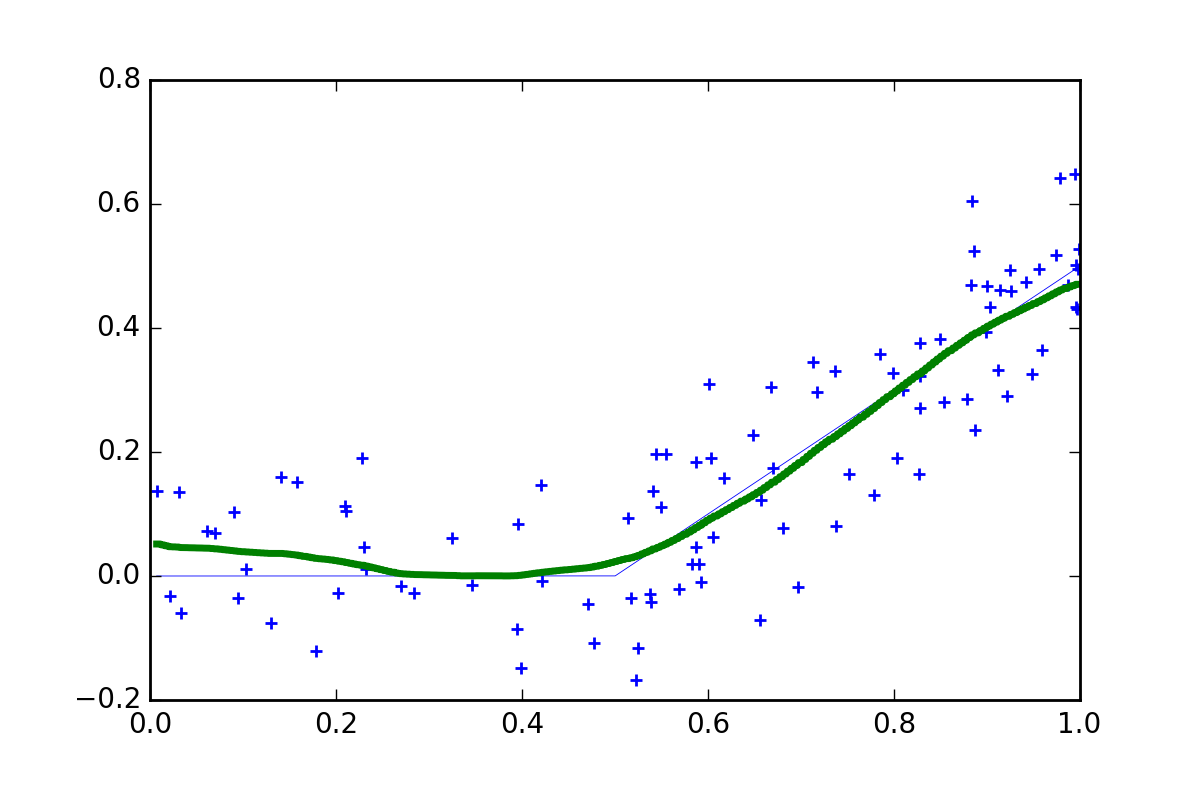
Of course, we can do a lot better in practice. What if we fit lots of 9 bin models but vary the position of the bins. Then we can combine the different step functions and take an average. This is known as an ‘ensemble approach’ (more specifically it is an example of Tile Coding).
More data
Now all of this has assumed a fixed sample of 100 observations. What happens if we vary our sample size.
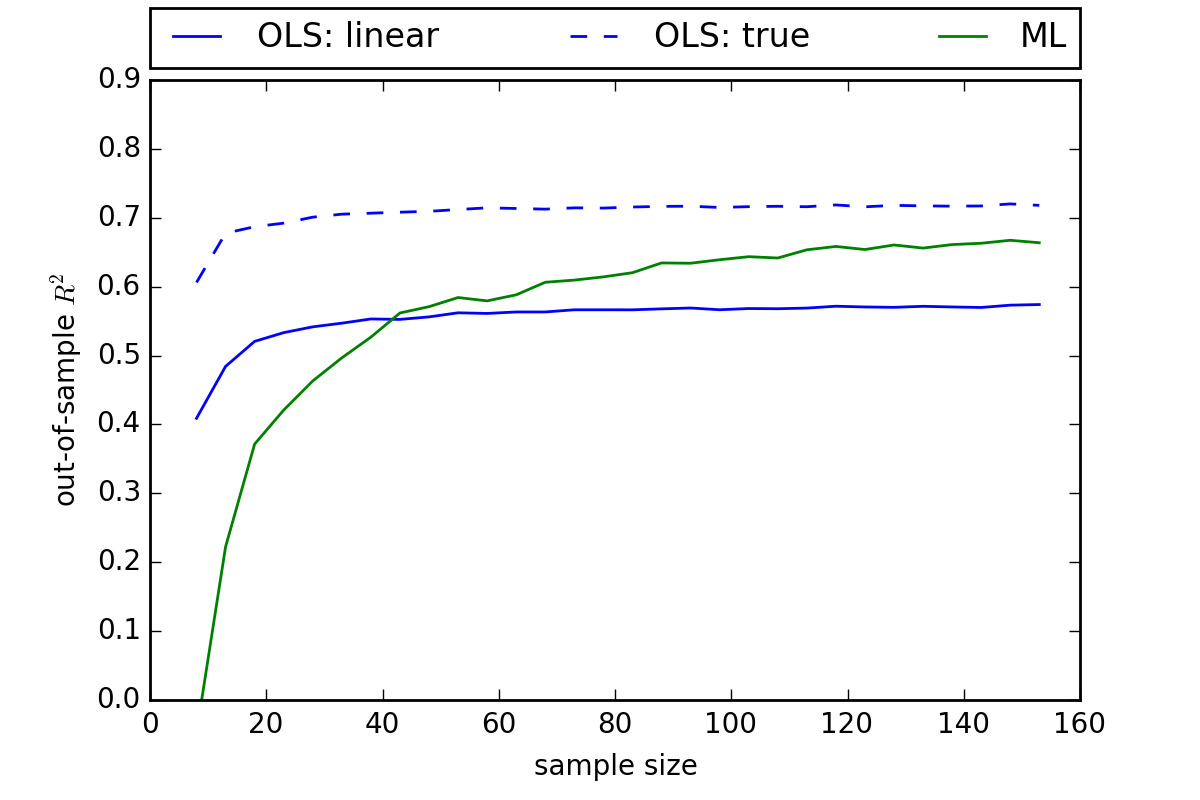
Here we see that our non-parametric (Tilecoding) approach outperforms linear OLS in samples of around 40 or greater. The basic point here is that non-parametric methods perform better with large data sets. The more data you have, the fewer assumptions you need to make.
ML Vs econometrics
The basic suggestion then is to use ML only when you have lots of data. In practice, the best option will depend on a range of factors including the type of the data available and the research objectives. Here are a few thoughts:
- No doubt, ML is suited to applications with larger data sets. But what constitutes large depends on the problem, including the number of \(X\)’s and the amount of noise involved. Further, with sophisticated ML algorithms the level of ‘generalization’ will adapt (or at least can be manually tuned) to suit the data (i.e., ML may still work with smaller data sets, just with higher generalization)
- If interest resides in measuring the marginal effect of specific \(X\)’s traditional methods may be a better idea. Although, in many cases marginal response information can still be extracted from ML methods if required.
- If the focus is on prediction then ML may be more appropriate. As Varian points out there are many applications in economics which can be cast as prediction problems (besides forecasting) including program evaluation. In my experience the field of productivity measurement is also suited to ML methods: predicting and ranking firm performance is the main focus (in fact non-parametric methods - like DEA - have a history in this area).
- In many cases, both types of analysis may be applied. In some cases ML and econometrics can even be complimentary. For example, you might use ML to identify the key explanatory variables from a large set (aka feature selection), then estimate marginal responses using econometrics.
What’s wrong with econometrics
There have been no shortage of researchers, willing to point out problems with applied econometrics (see for example McCloskey and Zilak).
I think a key issue is the perception of ‘academic rigour’. In some circles, econometrics will be seen as more ‘rigorous’ than ML, simply because it involves more formal math. But complex models and statistical tests are only useful if the assumptions they are built on are reasonable. In many ways ML with its focus on out-of-sample prediction and minimal reliance on theory could easily be seen as more ‘rigorous’ or at least more ‘scientific’.
Whats wrong with ML
In short plenty. ML is a young field. The goal is a set of general purpose algorithms that require minimal human effort. The reality is a massive array of complex algorithms each suited to specific problem types, and often requiring human expertise in ‘tuning’ meta-parameters (to get an idea go check out sci-kit learn). There’s certainly been progress: ensemble methods (like Breiman’s Random Forest) are more general and easier to use than earlier methods like Neural Networks - but there’s still a way to go.
Varian points out that ML is lacking in time series and panel data methods and there’s no doubt econometrics is a fair way in front there. Varian also makes a big issue about causation: basically that ML is good for correlation and prediction, but can’t establish causality. I agree, only I don’t think econometrics has much to offer in this regard either. When it comes to causation some degree of theory and introspection is required regardless of the method used. This is one area, where humans still have an advantage over machines.