The greatest team of all: AFL team performance since 1990
Brisbane now have the most premierships in the AFL era (1990 to 2026), but which team has the highest win percentage?
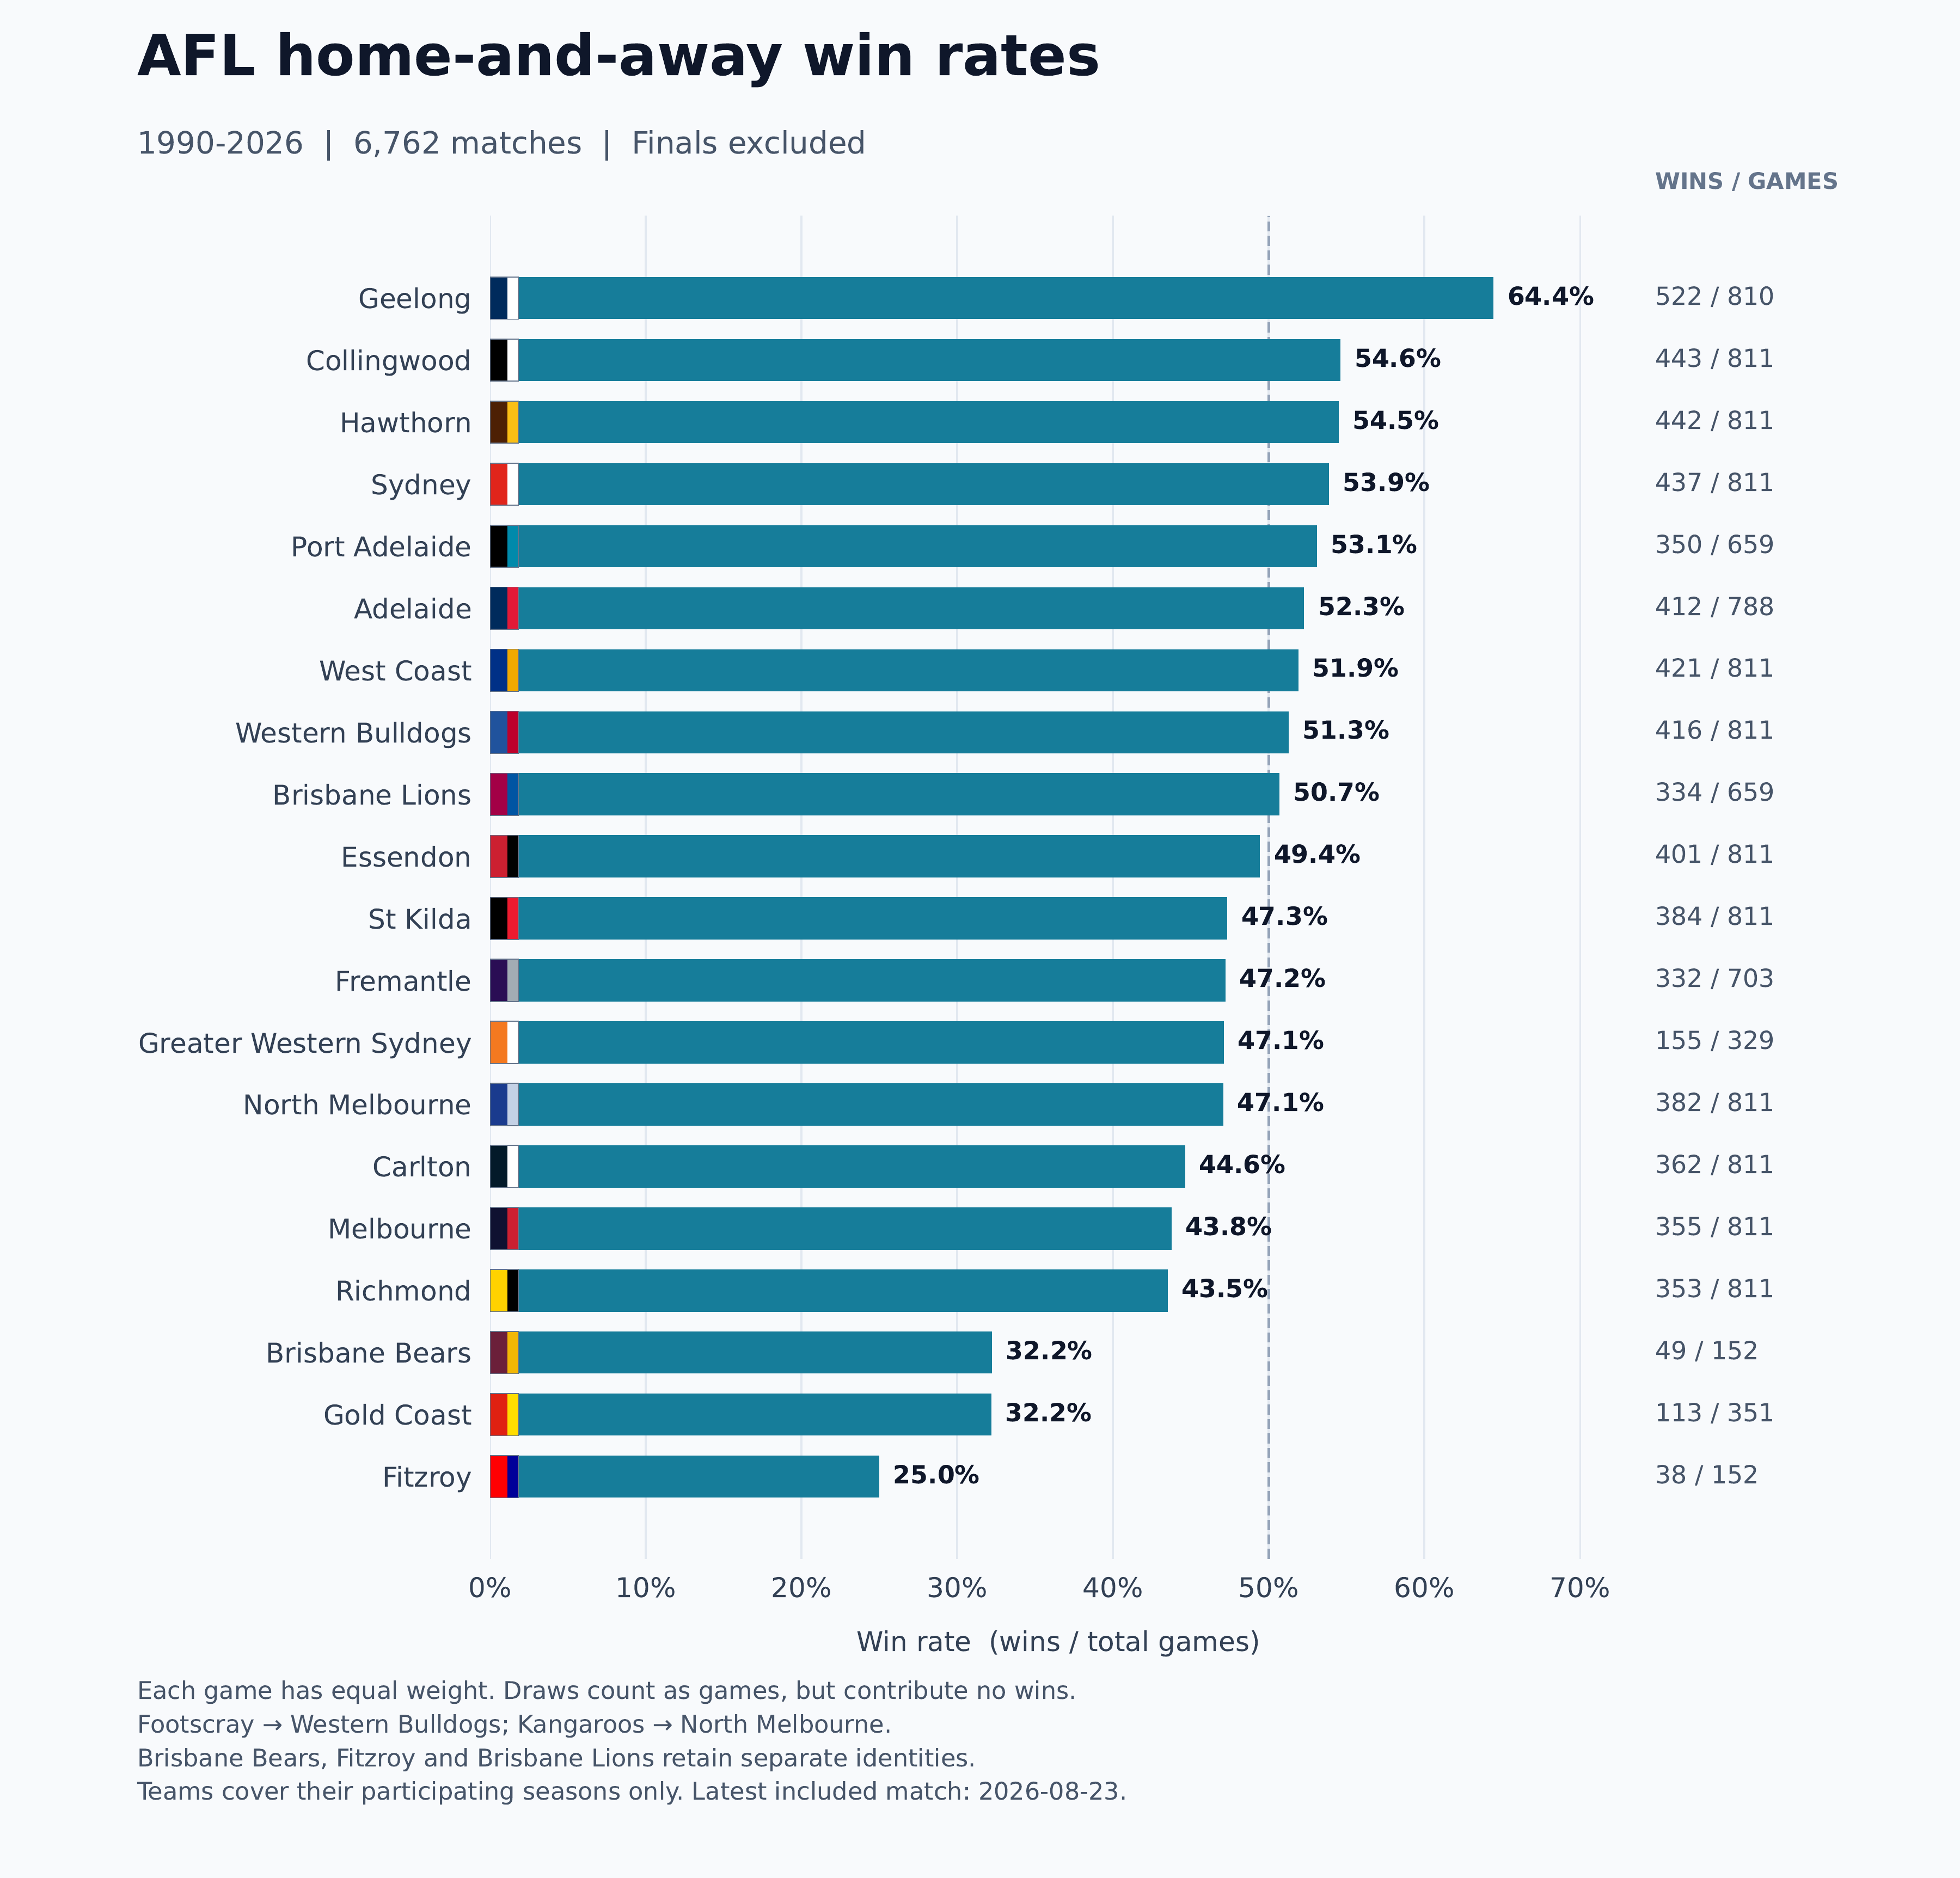
The answer is the Geelong Cats, and by a fair margin. Geelong have a win percentage of 64.4% in 810 home-and-away games since 1990, well ahead of the next-best: Collingwood at 54.6%.
Now, this chart is sure to annoy a lot of people, particularly since Geelong seem to have become the most hated team in the AFL.
Critics will point out that Geelong don’t have the best finals record. They might also argue that Geelong’s home-and-away performance is inflated by their home-ground advantage at Kardinia Park. (They might go further and float conspiracy theories involving “FARMS” and “COTTON-ON”, but let’s not indulge that nonsense …)
In case it hasn’t been obvious to this point, I’m a Geelong supporter, and this article focuses on Geelong. But I’m not here to take a victory lap. I want to take a look at the AFL data since 1990 and attempt to answer some questions: How have Geelong maintained such a strong home-and-away record? How much of that can be explained by Kardinia Park? And why hasn’t this translated into more premierships?
At home or far away
Geelong are in a unique position as the only Victorian team with a dedicated home stadium. Geelong are also one of the few clubs to have played consistently at the same home venue since 1990 (the others being Sydney at the SCG and Melbourne and Richmond at the MCG). Kardinia Park is the narrowest playing field in the AFL, and Geelong are able to train there consistently (a luxury many other Victorian teams don’t have).
So what does the data look like when we try to control for that?
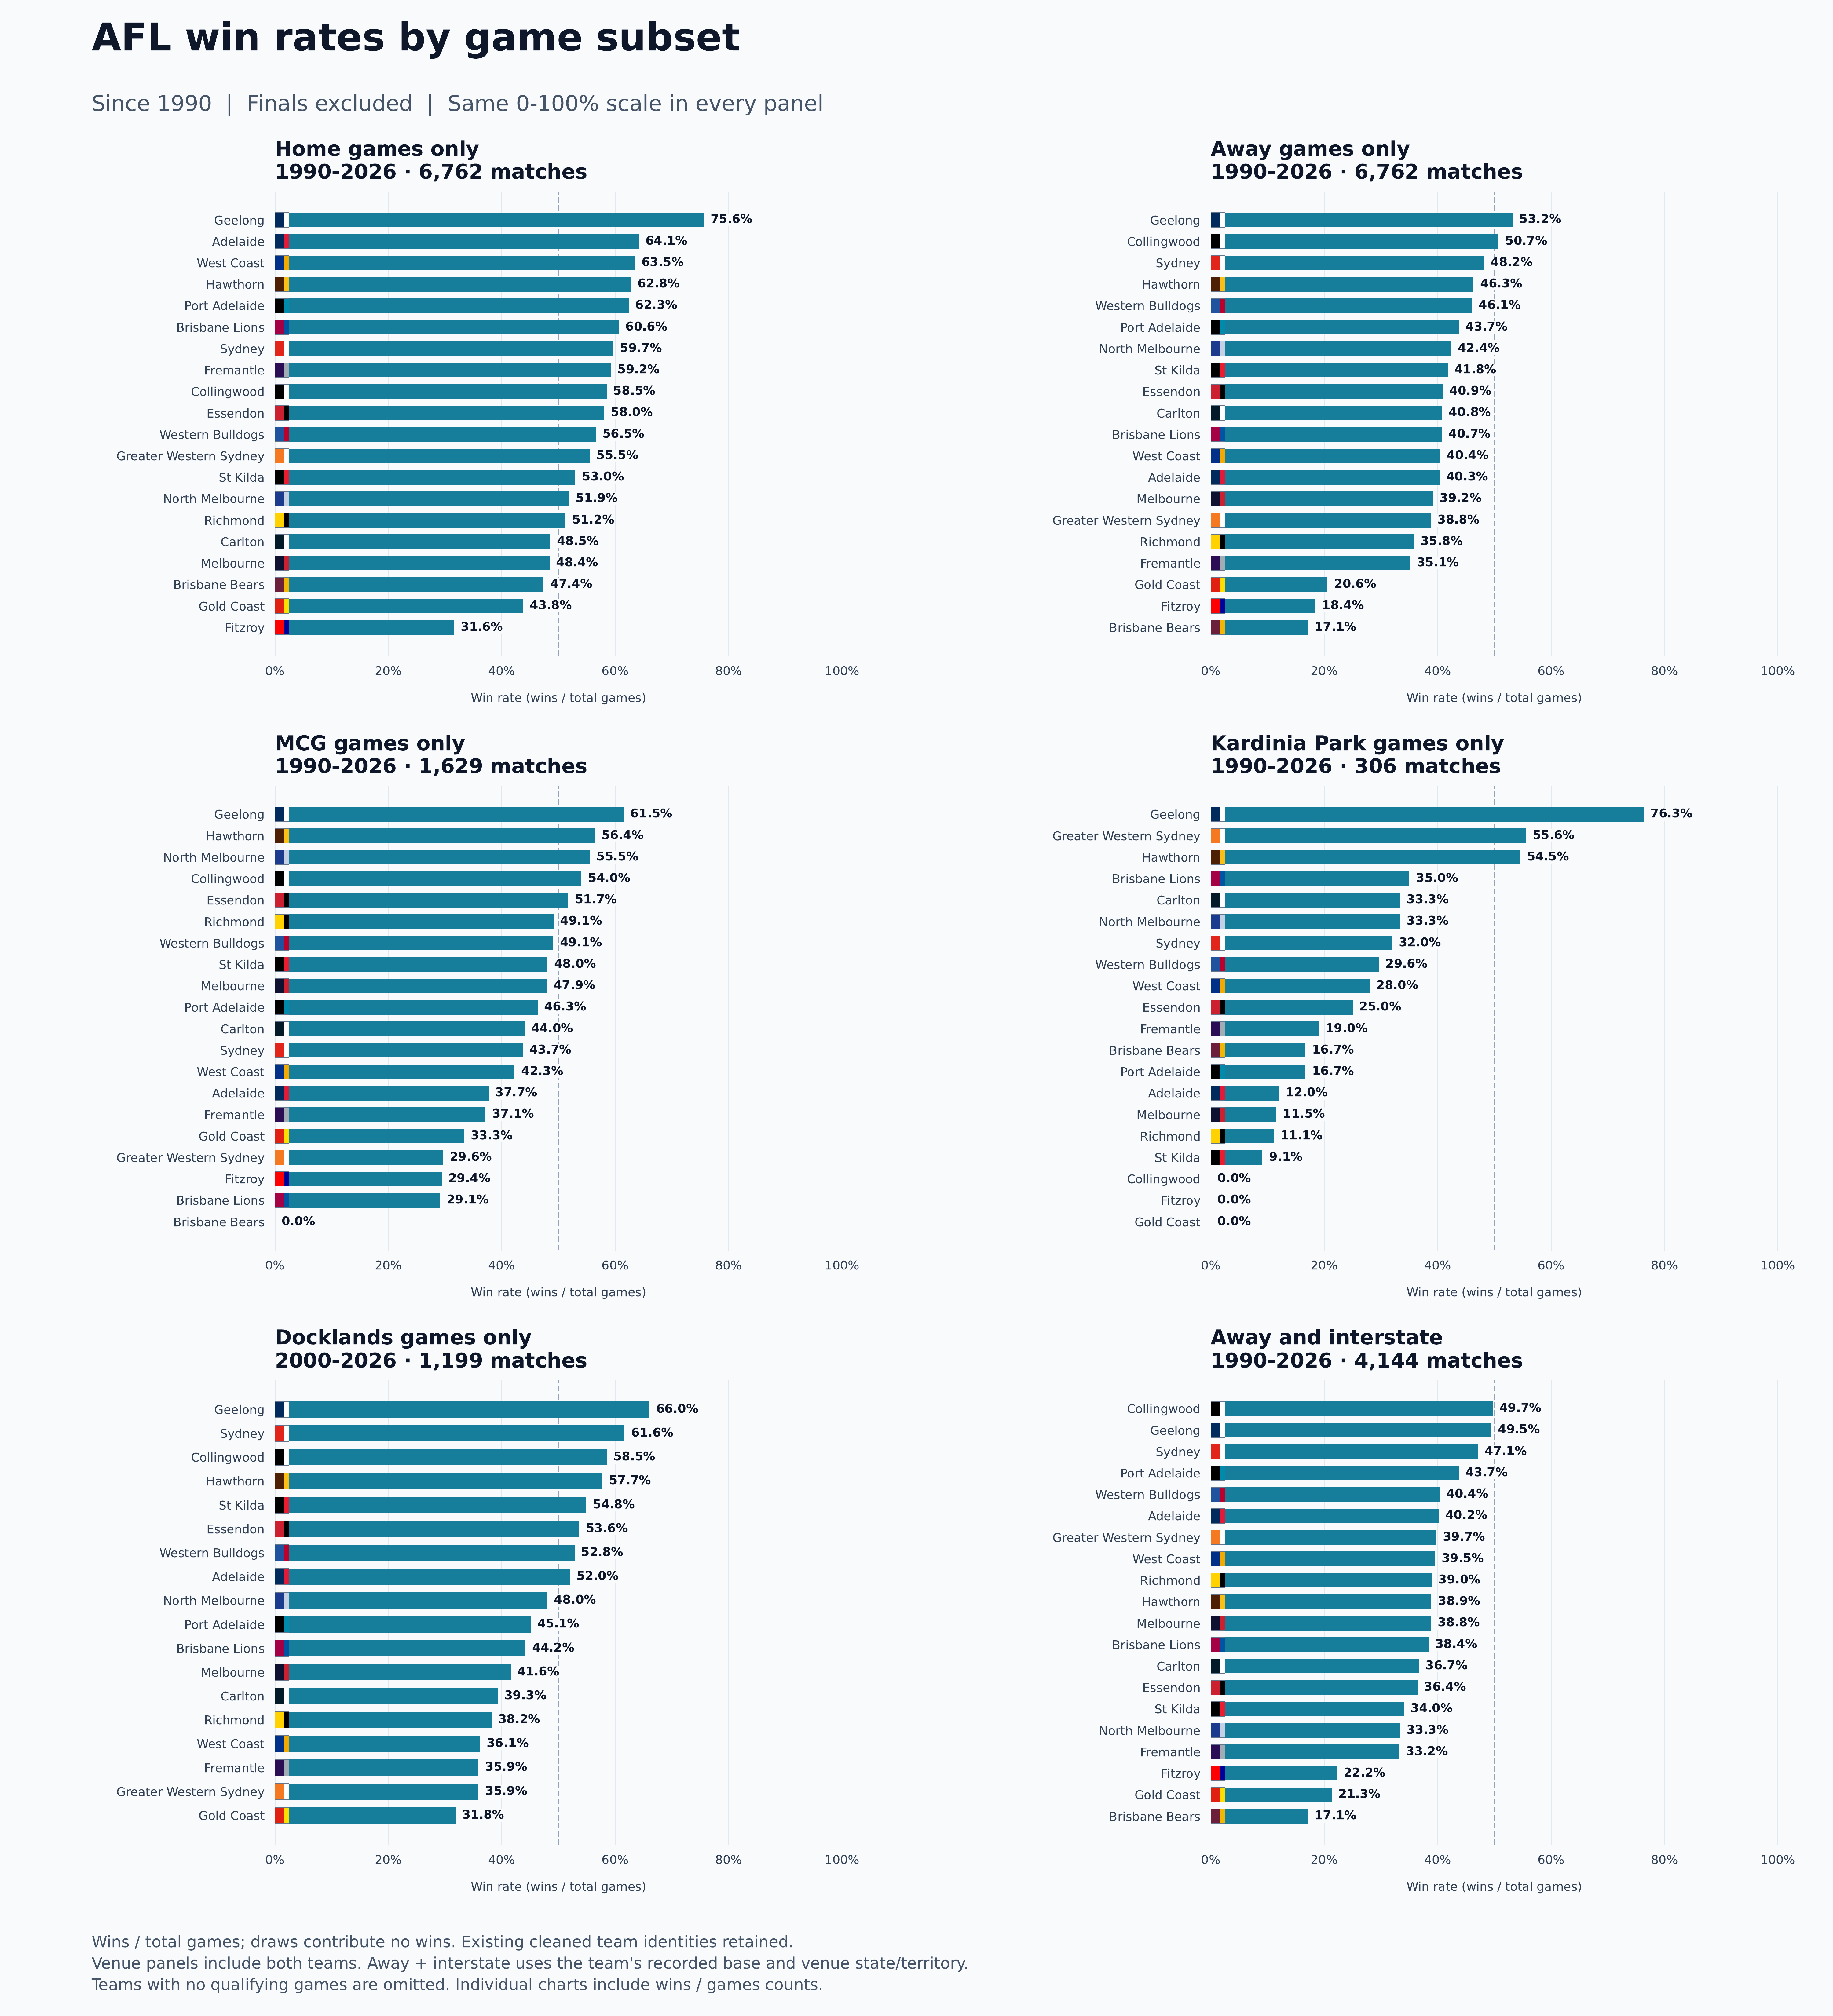
Geelong have clearly done well at Kardinia Park, with a win rate of 76.3%. But they have also done well at other venues. Geelong still have the highest win rate for away games at 53.2%, with Collingwood at 50.7% (though Collingwood’s away record may itself be inflated by playing a lot of away games at the MCG). Dig deeper, and Geelong have the best win rate at both the MCG and Docklands, and are second for win rate in interstate away games (0.2 percentage points behind Collingwood, at 49.7%).
Unpacking the effect of Kardinia Park is complicated by the fact that Geelong tend to play interstate teams and smaller Victorian clubs at the venue (with ‘blockbuster’ games against bigger clubs, particularly Hawthorn and Collingwood, typically played at the MCG). Further, since 1990 Geelong have, on average, played only eight of 11 home games at Kardinia Park. Geelong also rarely play finals there. Across all 880 home-and-away and finals games since 1990, Geelong have played only around a third (305) at Kardinia Park.
A model of team performance
To get a better picture, we have to go a bit further and build a statistical model. I won’t bore you with the details (they can be found here for those interested). The basic idea is to measure the performance of each team in each season since 1990, controlling for the quality of the opposition, travel, hosting status (i.e., home or away), and venue effects. This model makes use of both home-and-away games and finals (with equal weight) and can be used to produce a ‘model-adjusted’ win rate: the percentage of games each team would win against a common league-wide opponent distribution at a neutral venue. The results look like this:
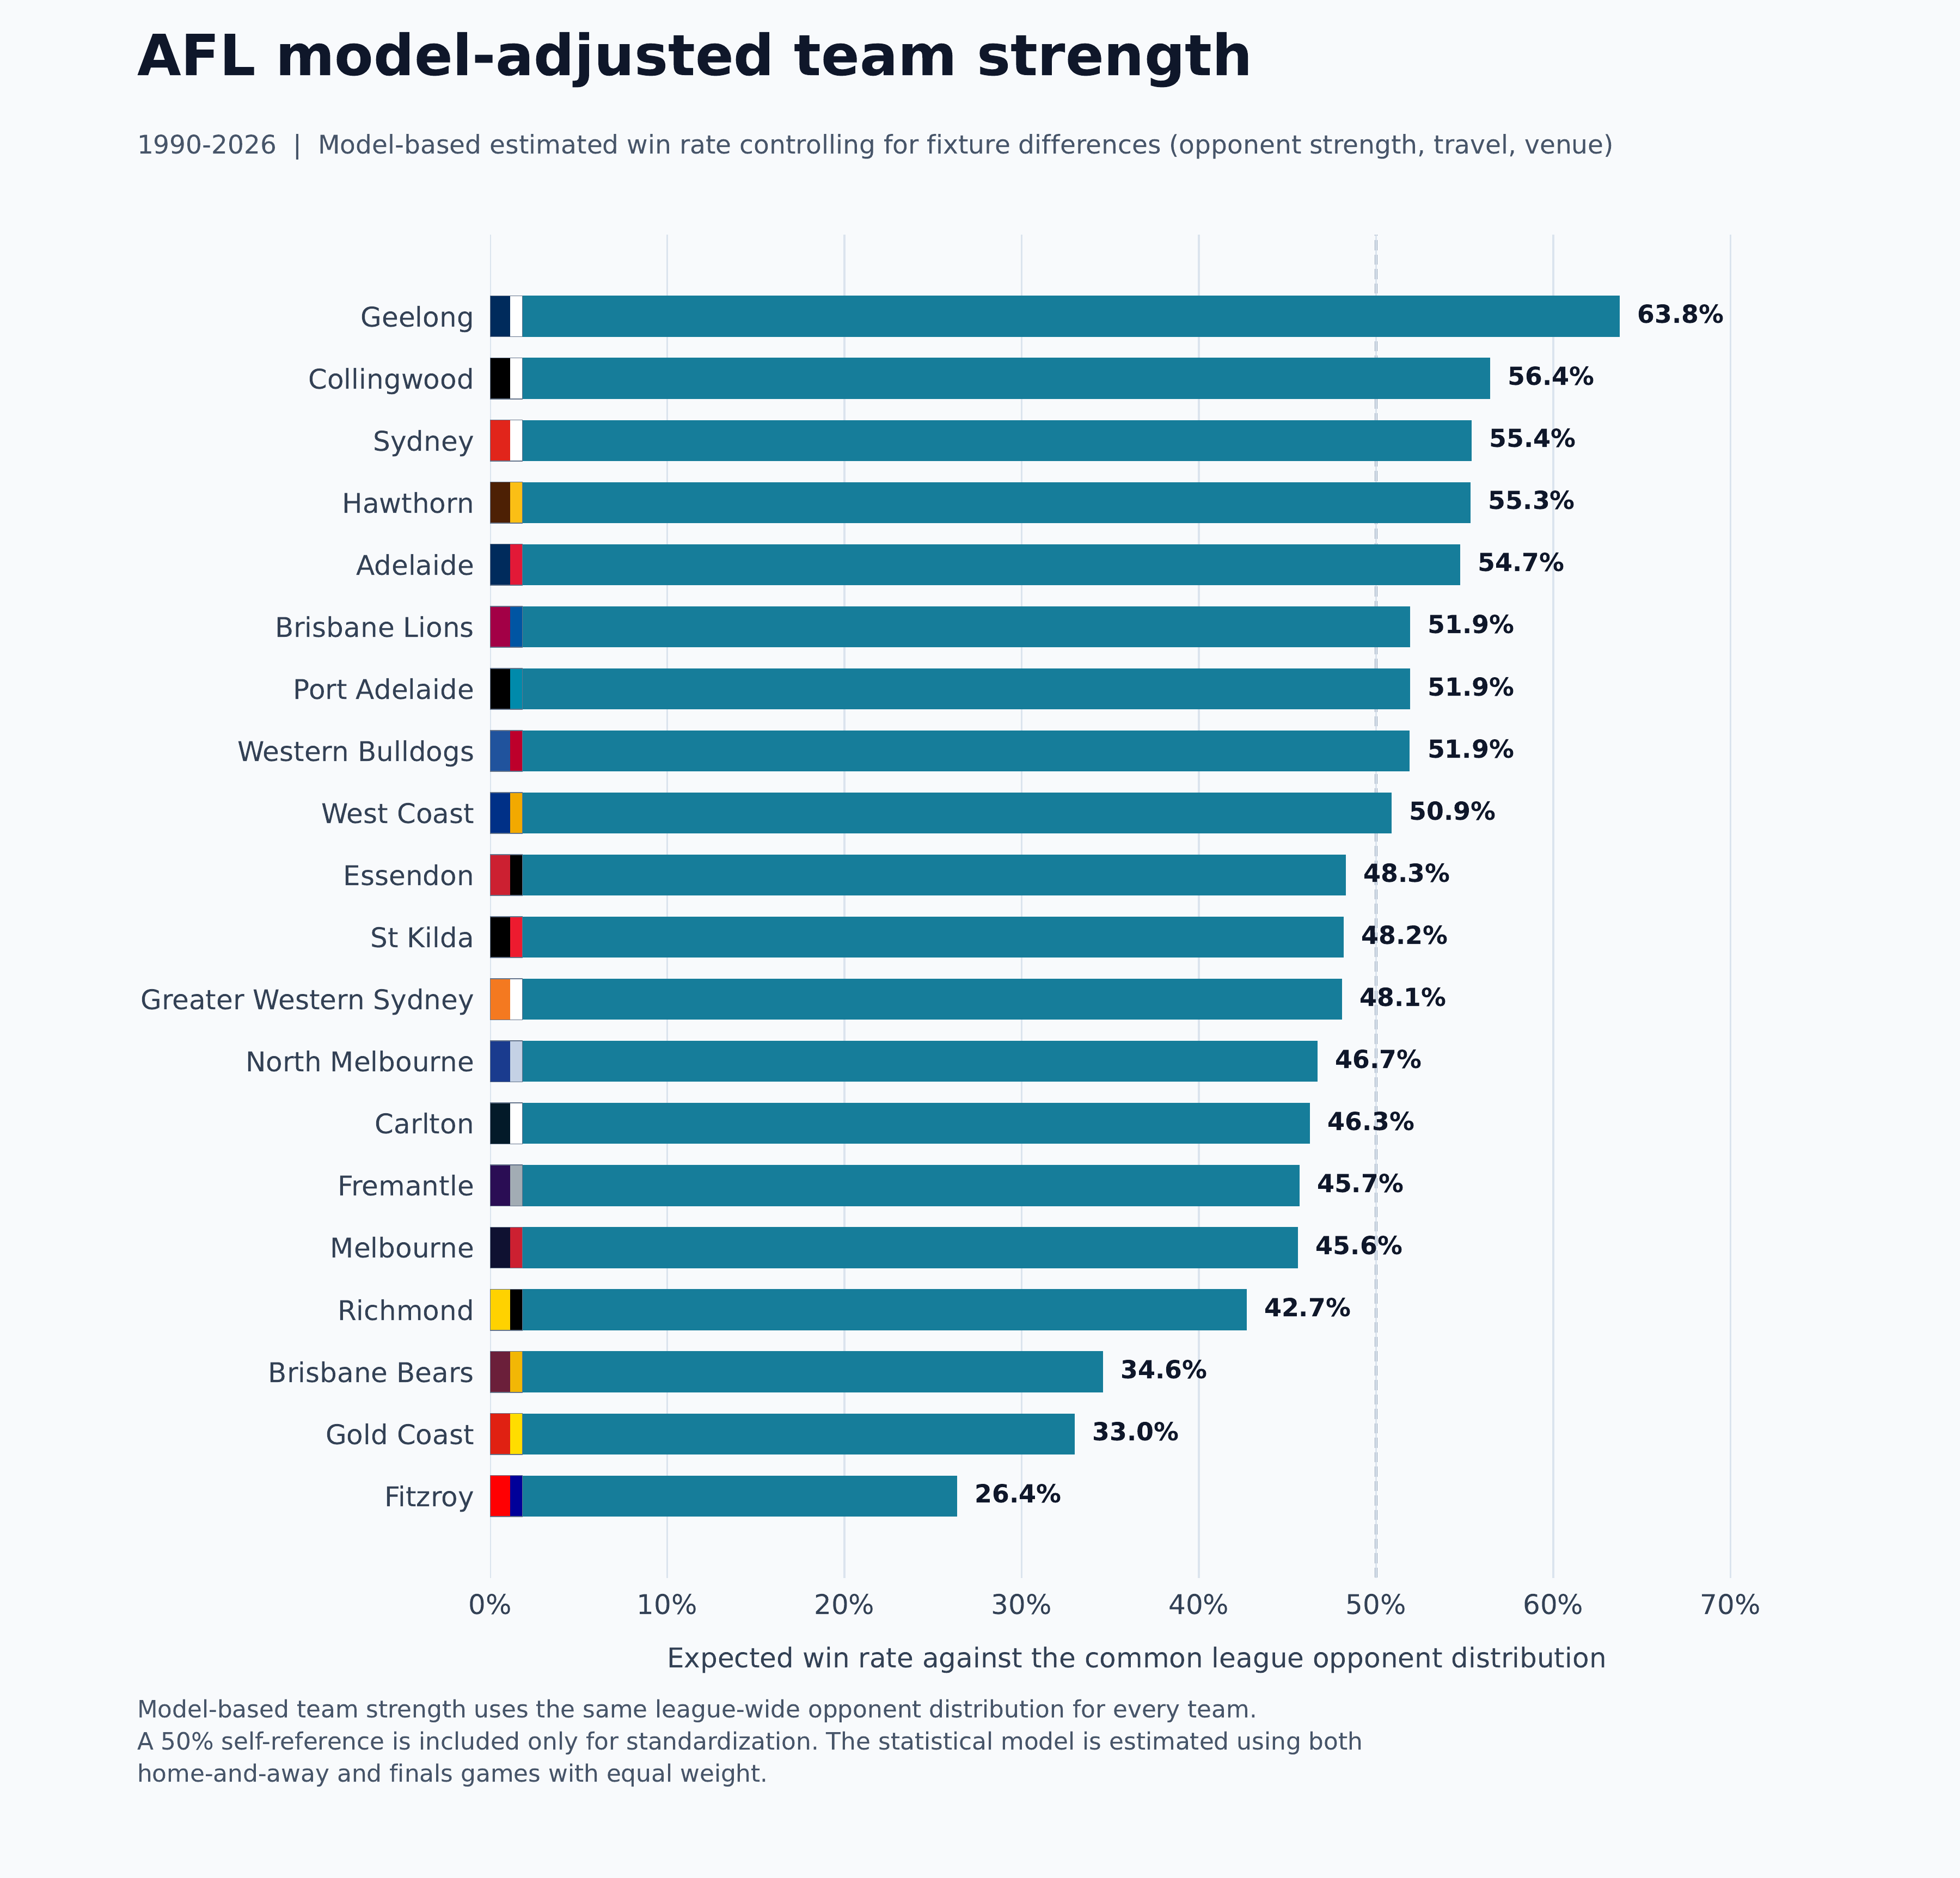
Overall, the long-run rankings since 1990 don’t change that much. Geelong are still out in front, although the gap to Collingwood is reduced by about a quarter (from 9.8 percentage points to 7.2). Meanwhile, some non-Victorian teams, particularly Adelaide and Sydney, improve a bit in the rankings.
We shouldn’t trivialise the effects of the draw: who plays who and where can have a big effect on ladder position within individual seasons. But over 36 years, it tends to wash out. There are more results we could get into here, including Victorian versus non-Victorian teams and the fact that Collingwood’s draw may not be as favourable as many people think. But let’s leave that for another time.
For now, we can answer one of our questions. Has Geelong’s win rate been inflated by Kardinia Park? Yes, but only a little bit.
What about September?
OK, now here’s the painful part for Geelong fans.
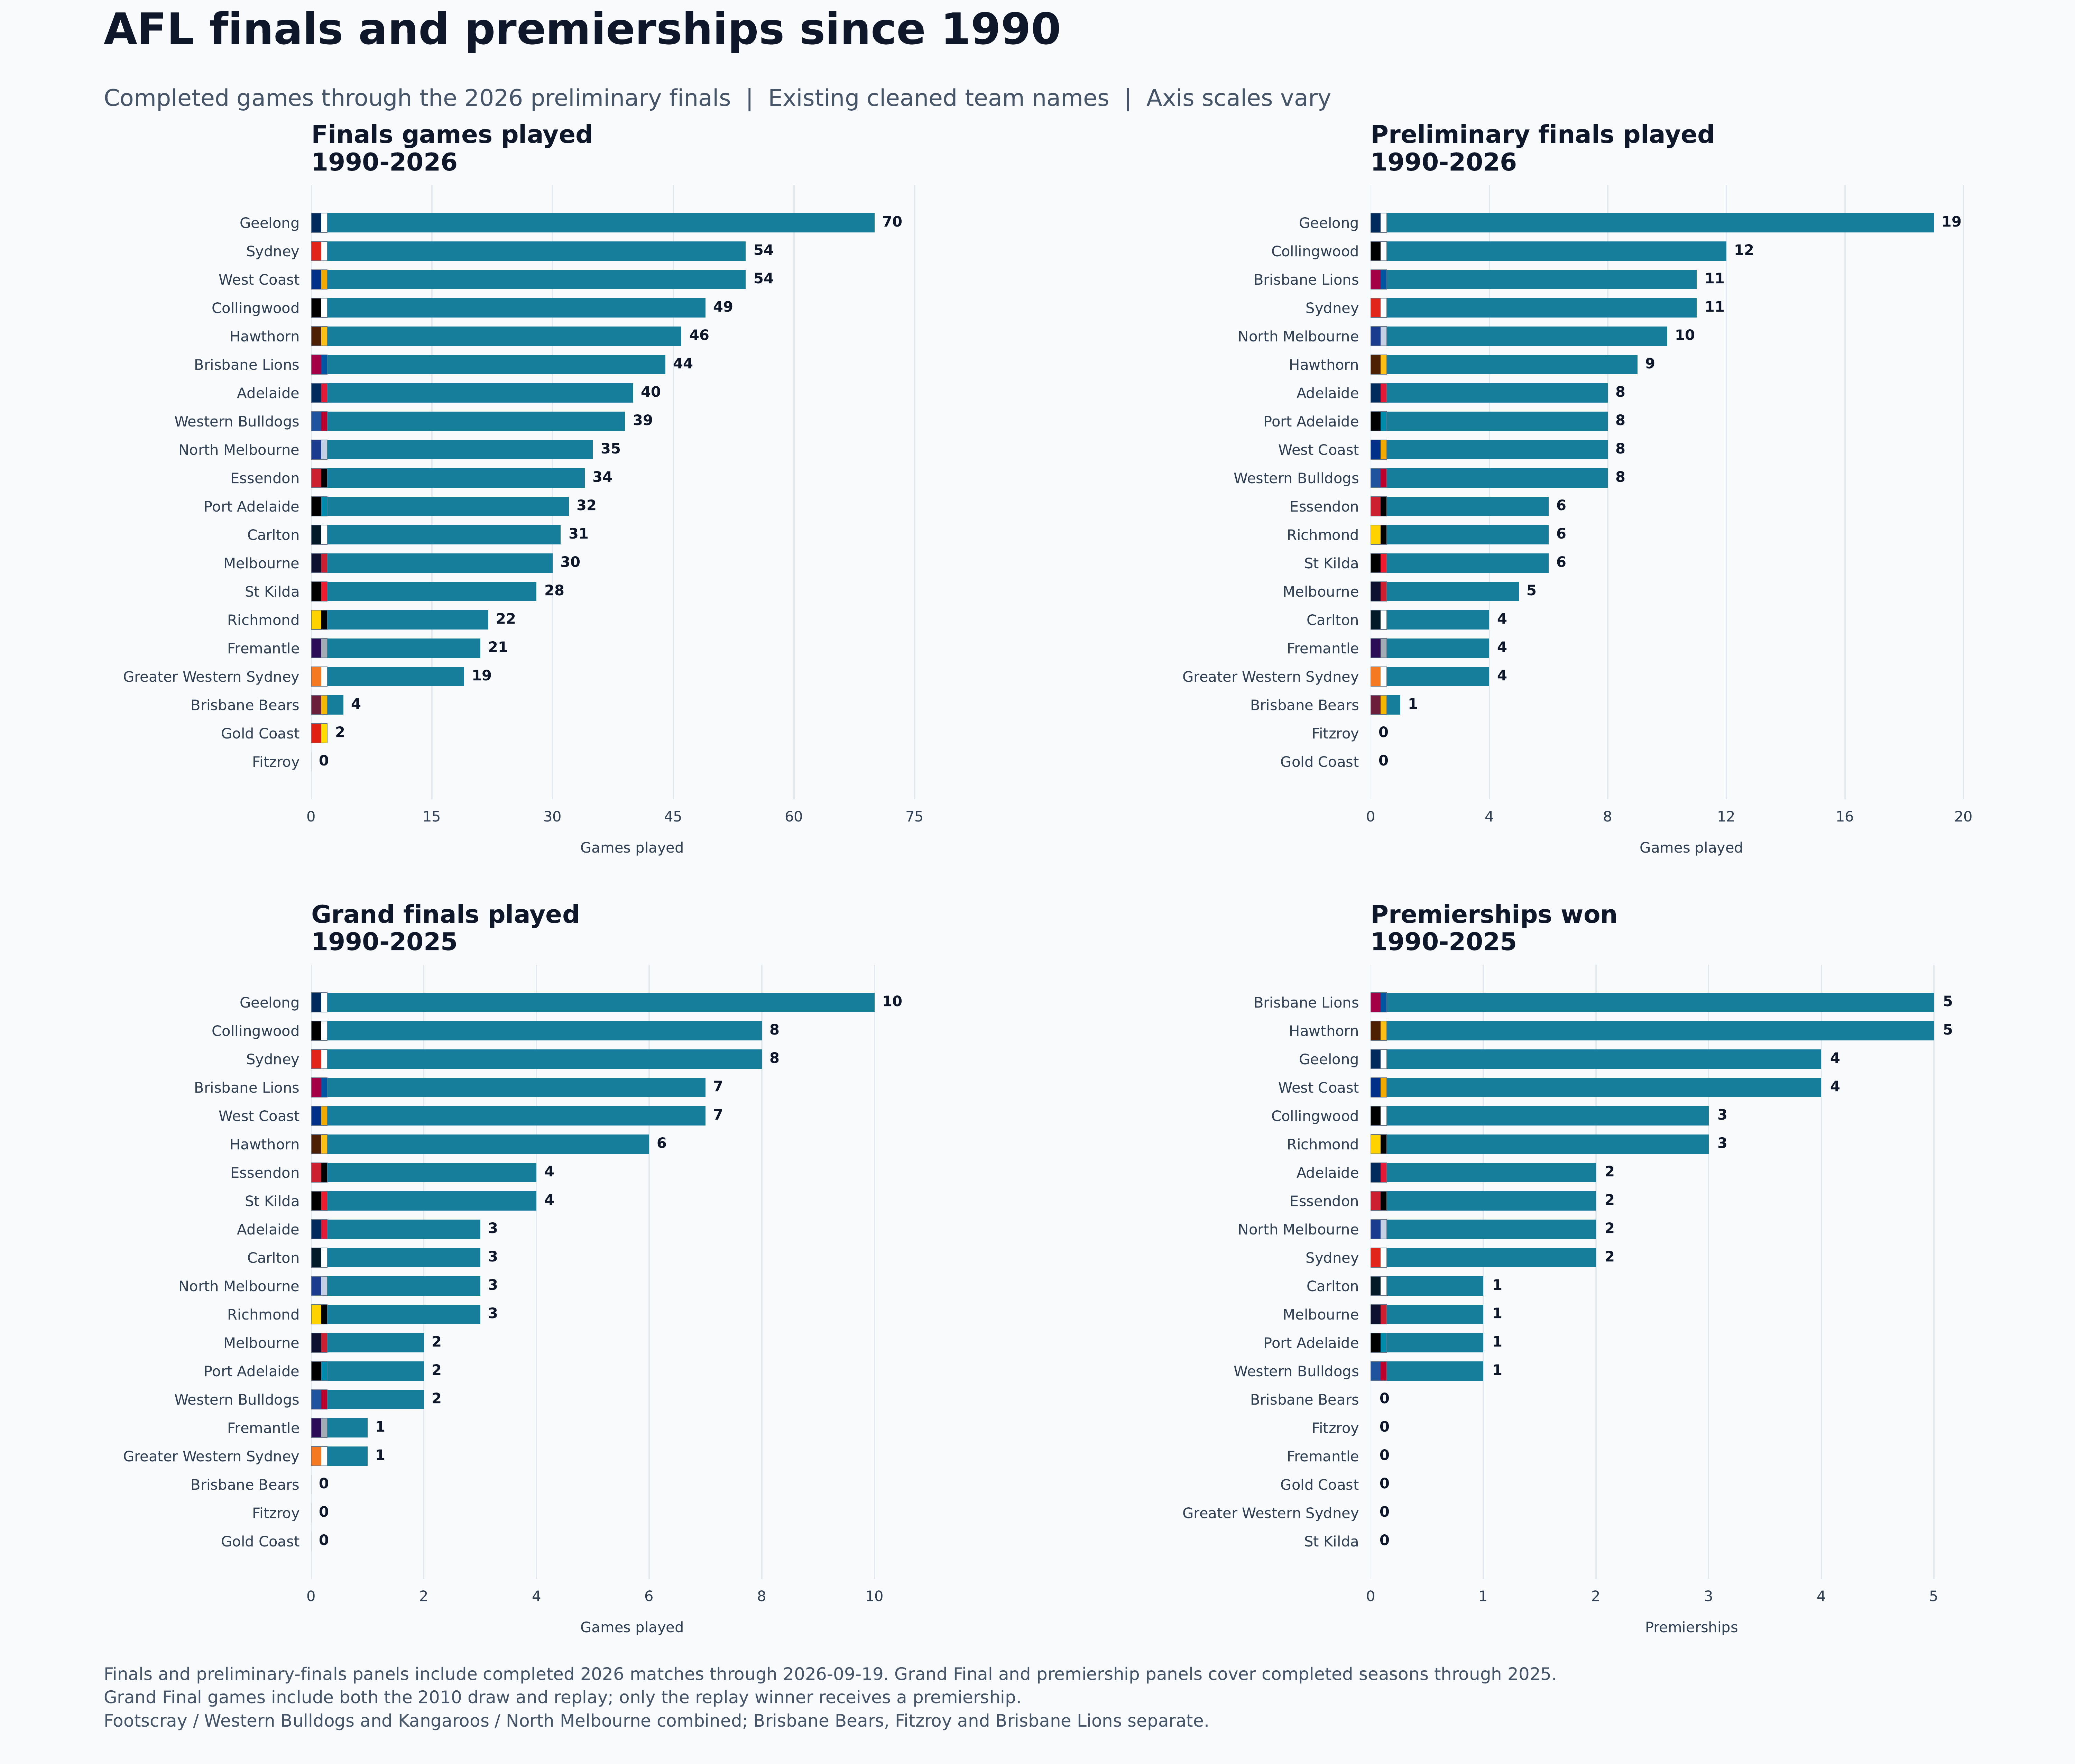
Geelong have played in more finals, reached more prelims, and played in more grand finals than any other team since 1990, but they don’t have the most premierships. That honour goes to Brisbane with 6 followed by Hawthorn with 5 (Hawthorn supporters would be quick to point out their 1988 and 1989 flags here, but you have to draw the line somewhere).
Making sense of finals is difficult given the small sample sizes. There have been many near misses for Geelong: Peter Matera in the 1992 grand final, missing the final six in 1993, the Leigh Colbert non-mark against Adelaide in 1997, Nick Davis in 2005, the 2008 debacle, the 2013 prelim that ended the “Kennett Curse”, the 2019 prelim loss to Richmond, Dustin Martin in the 2020 grand final, Tom Stewart’s concussion, then Jeremy Cameron’s broken arm in 2025 (OK, OK I’ll stop). Of course, all teams have their share of hard-luck stories. The point is that, when it comes to finals, the gap between glory and heartbreak is pretty small.
Since 1990, Hawthorn and the Lions have been effective at converting finals appearances into premierships. Hawthorn have five premierships from nine prelims and six grand finals (including one flag in the 1990s without a prelim under the old finals system). Meanwhile, the Lions have six flags from eight grand finals.
Geelong are not the only side to have fallen regularly at the final hurdles though. Sydney have two premierships from 11 prelims and eight grand finals, while Port Adelaide and the Bulldogs both have one flag from eight prelims and two grand finals.
While the sample sizes are small, we can try to be a bit more precise and use a version of our model to evaluate finals performance relative to home-and-away form. The chart shows that, in relative terms, the Lions have performed the best in finals over the period, being on average 8.5 points per game better than their home-and-away form would suggest. Geelong are mid-pack, with finals form more or less matching their home-and-away form on average.
So while Geelong have clearly had some off days in September, it seems they’ve often just been beaten by the better team.

Is refusing to bottom out part of the problem?
History suggests that AFL team performance tends to go in cycles. Demographics, salary caps and the draft usually catch up with champion teams eventually: Brisbane after 2004, Hawthorn after 2015 and Richmond after 2020 all had steep drops in form, followed by multiple years in the bottom half of the ladder. The traditional wisdom has been to lean into these cycles: to “bottom out” and “rebuild”.
Open this interactive graphic to explore each club’s ladder position and model-adjusted strength by year since 1990.
Since Chris Scott took over in 2011, Geelong have taken a different path, remaining consistently near the top. By 2022, only three players were left from Geelong’s 2011 premiership side; a complete rebuild without bottoming out, achieved partly by recruiting mature-age players from other AFL teams, lower leagues (the VFL, WAFL and SANFL) and other sports (e.g., Gaelic football and athletics).
But does staying competitive year in, year out make it harder to reach the pinnacle? Sydney and Collingwood have had a similar experience to Geelong at times, remaining competitive for long periods and having many near misses. History seems to suggest that a good recipe for a premiership is a core of young talent that stays together then reaches its athletic peak at the same time. All the recent dynasty teams (from Geelong’s 2007-2011 team to Brisbane’s recent three-peat) have had extended periods in the lower half of the competition before their premiership window.
Then again, what if another team is peaking when you’re peaking—like St Kilda in 1997, 2009 and 2010? In any case, history may not be the best predictor going forward: the competition and its rules are always changing, free agency is increasing player movement, sports science is extending careers, new clubs are entering, and so on. This is a complex area, and while it’s tempting to speculate, I’m not sure there are any easy answers yet.
What’s made Geelong so consistent?
Many would argue that comparing sporting teams over such long periods is pointless. In 36 years, the players, coaches and administrators of all these clubs have turned over many times. We might talk about the Kevin Sheedy-era Bombers, the Leigh Matthews-era Lions, etc., but the 1990–2026 Cats? That’s a bit meaningless.
Perhaps. But I think in Geelong’s case there are a couple of things we can speculate on:
First, while we shouldn’t get too romantic about “culture”, there must be something to say about Geelong’s history and connection to place. While Geelong had a difficult period in the late 1990s and early 2000s, they didn’t face the existential risks that other Victorian teams did (e.g., North Melbourne, Melbourne, Hawthorn, Footscray and Fitzroy). Geelong might be derided as ‘Sleepy Hollow’, but that stability is clearly an asset. Ford has sponsored Geelong for over 100 years. Meanwhile, Geelong have had only four head coaches since 1990. By my count, Carlton have had 11. Cause and effect might go both ways with coaching turnover, but there has to be some benefit from continuity.
The second factor is easier to define and harder to argue with: Stephen Wells. As far as I’m aware, he’s the only person connected to Geelong for the entire period, having joined as an assistant recruiter in 1984. Wells’ ability to unearth playing talent with late draft picks and rookies has been well documented and is arguably the most important factor in Geelong staying competitive for so long.
Glass half-full or glass half-empty
For some Geelong fans, the pain of the near misses and the nagging feeling that premierships have been “left on the table” is hard to take. At the same time, by just about any statistical measure other than premierships, Geelong have been the best-performed team since 1990. And most other teams, except Brisbane and Hawthorn, would probably take Geelong’s record if they could. When you think about it like this, being an unhappy Geelong supporter in 2026 would seem like extreme ingratitude.
What about the haters? It’s fair to point out that Geelong’s win rate is affected by our home-ground advantage. But it doesn’t explain all of it. Supporters of Hawthorn, Brisbane and Richmond might say to themselves, “We beat them when it matters”; others might clutch at conspiracy theories. But the truth is probably more mundane: off-field stability, a good recruiter and a couple of bad days in September.