Pivotal documentation
Pivotal is a data analysis language for Python. It offers a concise syntax for common data operations that compiles to Pandas, Polars or DuckDB code. With comprehensive JupyterLab and VS Code support Pivotal provides a friendly entry point to the Python data ecosystem.
A live-demo of Pivotal in Jupyter Lab is available via Binder:
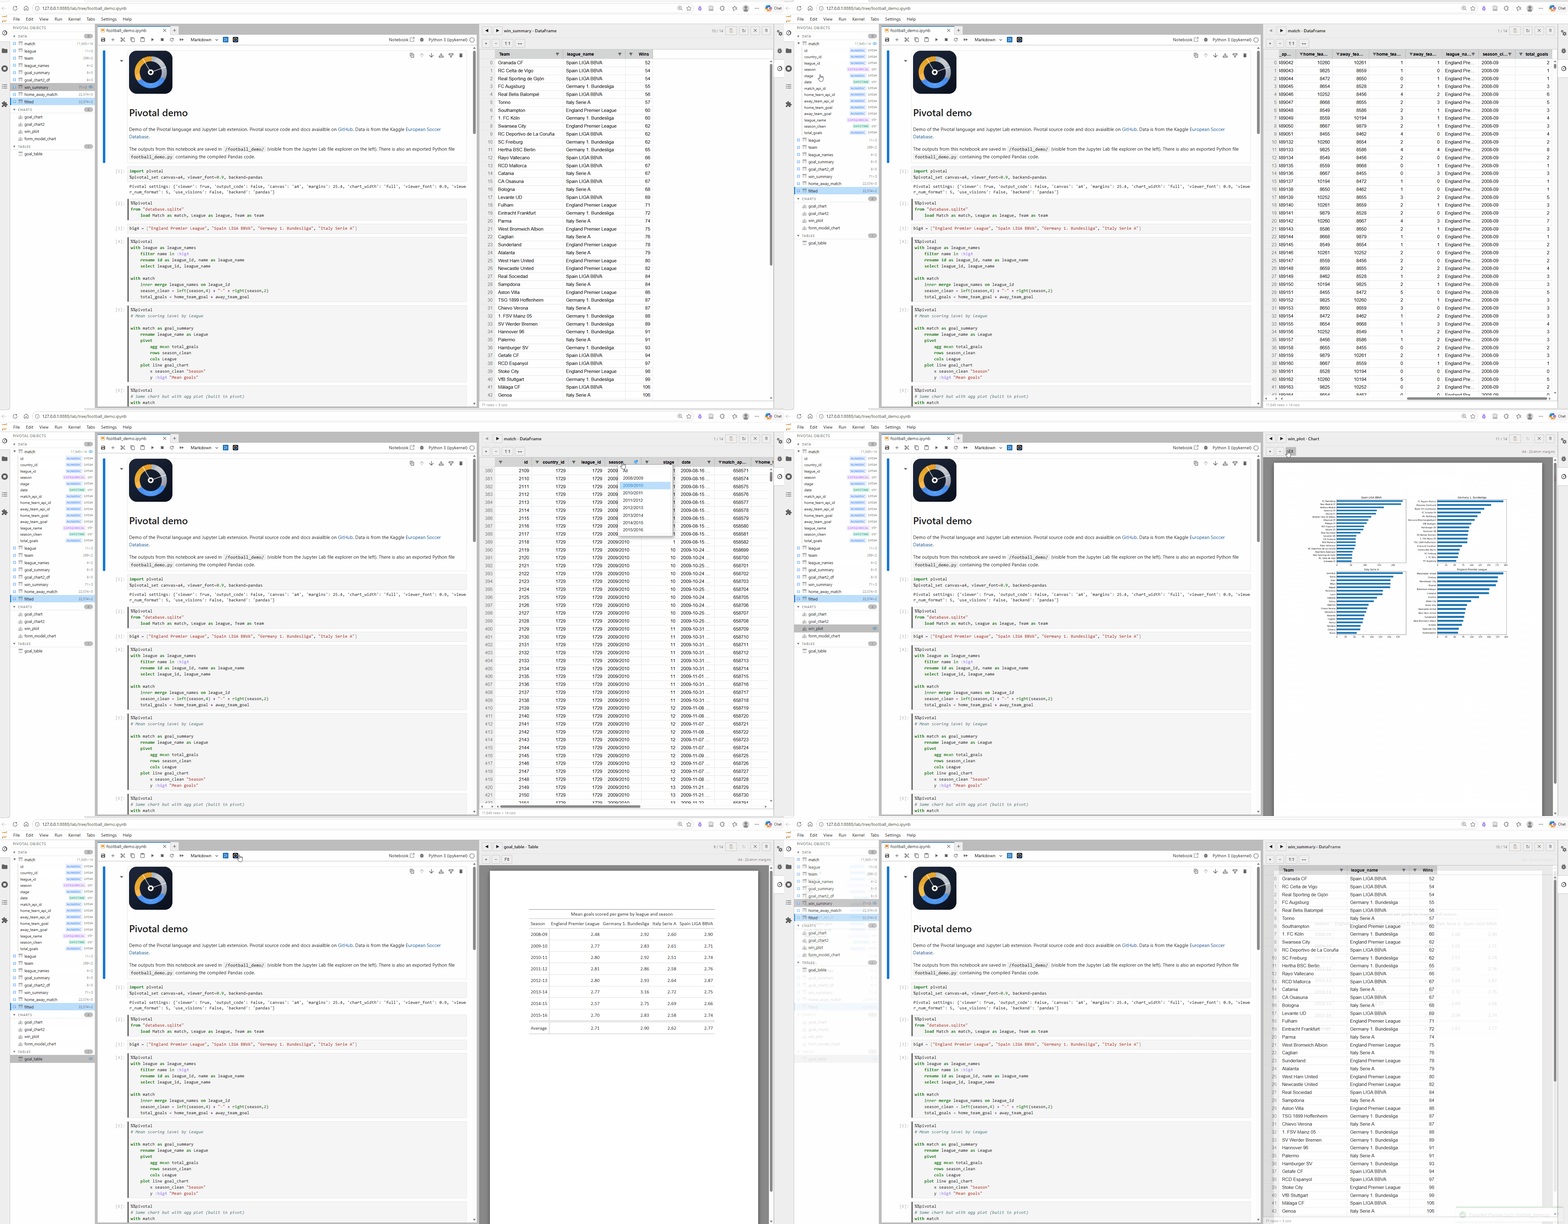
Key features
Readable, writable syntax - write data transformations in a concise declarative syntax that feels familiar to SQL and Pandas users
Multiple backends - compile to Pandas, Polars, or in-process DuckDB SQL
JupyterLab and VS Code integration - syntax highlighting, autocomplete, %%pivotal cell magic, interactive object viewer and explorer, and GUI controls
AI support - ask an LLM or coding agent to generate, run, verify, and compare Pivotal code via the Pivotal MCP server
Comprehensive data pipelines - build full workflows with data-quality checks, pipeline functions, column loops, and loadable config / metadata values
Plotting and tables - create charts and publication-ready tables with simple syntax, backed by matplotlib and Great Tables
Data packages - export DataFrames, charts, and tables to a single Frictionless data package
Python integration - call Python functions, load Python variables, and mix Pivotal and Python code as needed
Install
This installs the full feature set - Pandas, Polars, DuckDB, Great Tables.
For a minimal Pandas-only install: