Who gets the best fixture in the AFL? (No, it's not Collingwood)
The 2027 AFL fixture came out this week, and within a few hours media outlets were telling us who had the best and worst draws. Fox Sports’ assessment, based on the 2026 percentages of double-up opponents, created some rage bait by suggesting Collingwood had one of the best draws.
But that analysis was rather basic. A more careful assessment has to look beyond which teams are played twice and consider the full fixture, including travel and venue. This should be obvious, and it was to many people on Reddit. But I guess being fast and controversial is more important than being right. (For what it’s worth, this assessment from SportPunter came out a few hours later and was much better).
Fixture advantage 1990 to 2026
Before getting into 2027, let’s look at the AFL history from 1990 to 2026 and see which teams have had the best fixtures on average. This analysis is based on a statistical model of AFL team strength that accounts for opponent, venue, travel and hosting status (details are here). The figure shows the effect of the fixture on an average-strength team’s expected win percentage, compared with a neutral fixture.
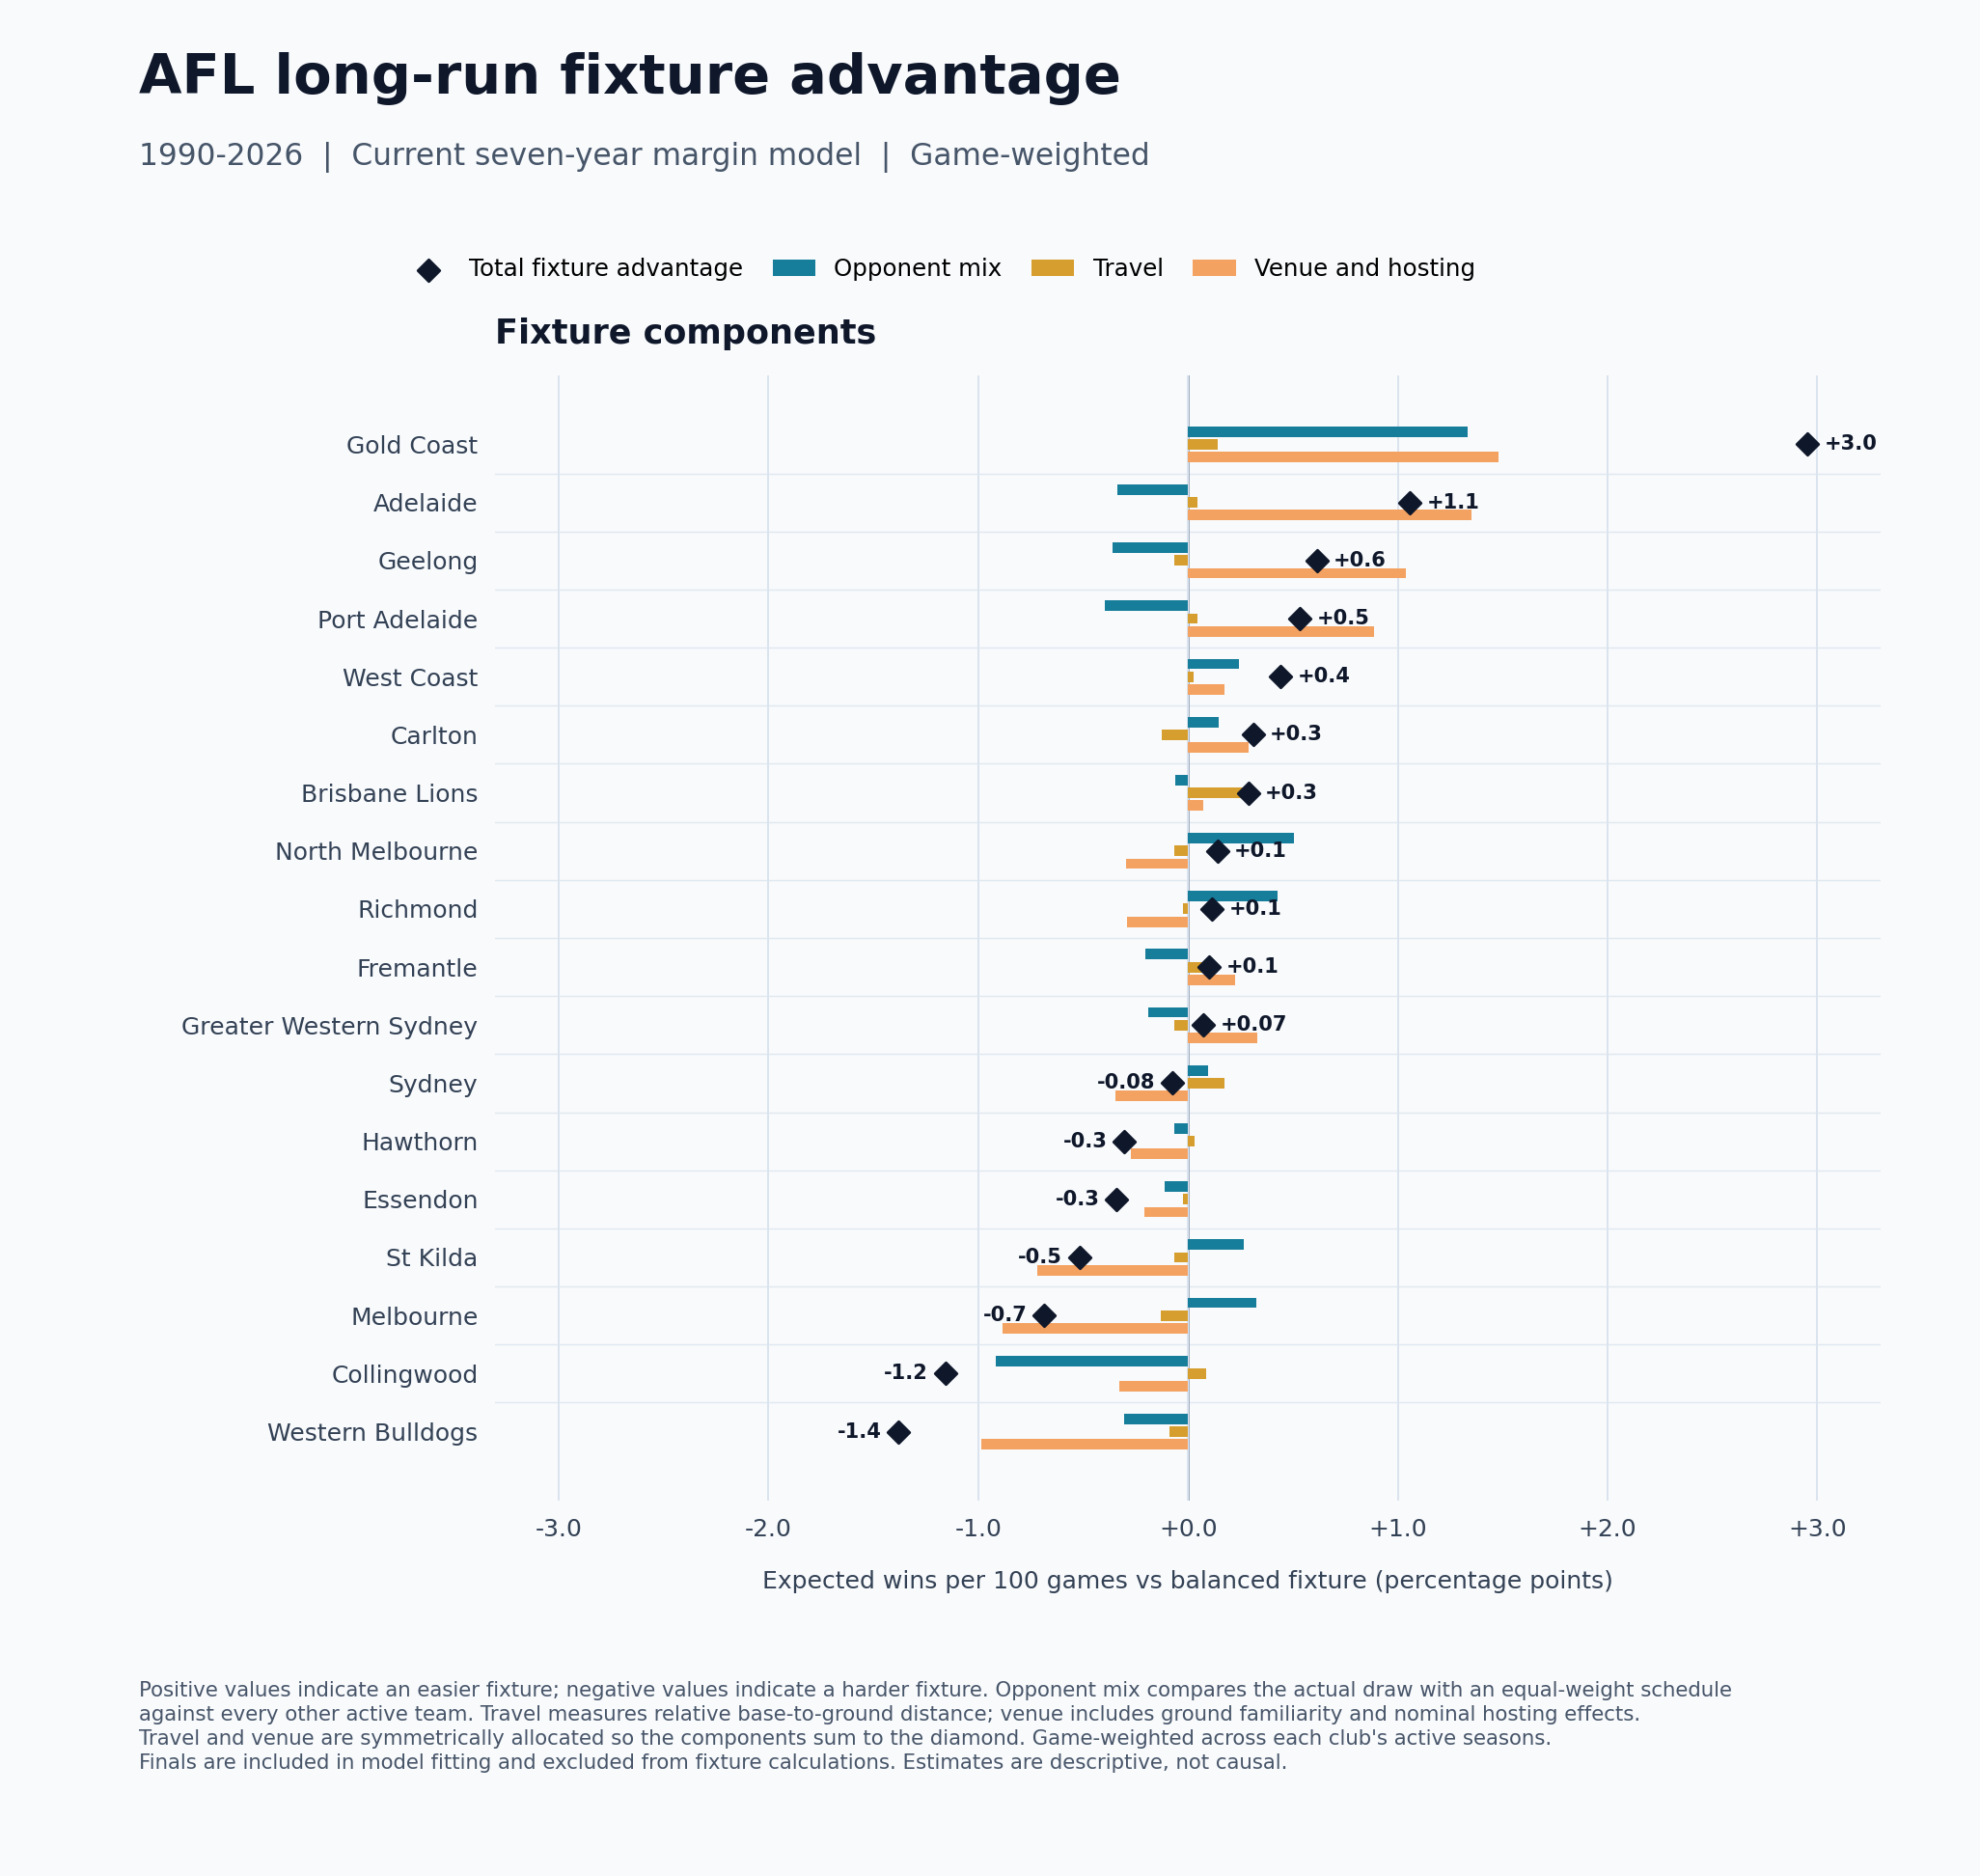
This shows Gold Coast as having by far the most favourable draw on average and the Bulldogs the hardest (the results are based on each club’s active seasons, so Gold Coast’s result covers a shorter period than those of established teams).
Since 2014 the AFL has used an explicit system that takes previous-season performance into account when allocating double-up opponents, giving weaker teams easier draws. Since Gold Coast have spent most of their history in the bottom third of the ladder, it’s perhaps not that surprising they have tended to get an easier fixture. Geelong, despite being in the top third of the ladder for much of the period, are reasonably high on the list, partly due to their unique position as the only Victorian team with a dedicated venue, which gives them a home-ground advantage (more on that here).
This assessment also accounts for aspects of the draw beyond opponent selection, including teams selling home games interstate. That can contribute to fixture disadvantage for clubs like the Bulldogs, Melbourne and St Kilda. There are some judgements in the model here about whether grounds are considered “familiar”: for example, it treats Ballarat as a second home ground for the Bulldogs, but not their occasional venues in Darwin and Cairns. Although to be fair, the Bulldogs have done better than Melbourne and St Kilda in their interstate “home” games in recent years.
Collingwood has a harder draw than people think
OK, so I ignored the most surprising result: contrary to public opinion, Collingwood do not get the easiest draw. According to this model, they have had the second-hardest fixture on average. Yes, Collingwood play a lot of games at the MCG and travel less than some other teams. But many of their games at the MCG are against other MCG-based teams, so the model assumes no ground-familiarity advantage (unlike, say, Geelong at Kardinia Park). Some might argue Collingwood get an advantage at the MCG from having a bigger crowd turnout than their opponents, but that’s not factored into the model.
Collingwood also play some nominal home games at Docklands, which the model treats as a neutral venue for them. Overall, Collingwood have done OK there, partly because they have tended to play weaker teams. In 2027, though, Collingwood will play both St Kilda and the Bulldogs at Docklands, more or less converting those two home games to away games.
Lastly, there is the “opponent mix” component. In the long run, Collingwood have had the hardest opponent mix relative to the model’s balanced-fixture benchmark. My guess is that, in addition to being a consistently strong team over the period, financial incentives to involve Collingwood in blockbuster games against quality opponents may play a part. Presumably, it is in no one’s interests for Collingwood to play lots of games against Gold Coast or North Melbourne. That’s pure speculation of course; some of this might be bad luck (fixtures are based on previous years’ rankings, so it doesn’t always work out as the AFL intends it).
So while there might be a few things to quibble about in this model (the effect of the Collingwood “army”, or whether Docklands should be considered “home” for Collingwood), it seems that, at the very least, Collingwood’s draw is not as easy as people think.
What about the travel burden for non-Victorian clubs?
The results above factor in relative travel distance for each game, but these effects largely cancel out over a season for non-Victorian teams: a disadvantage away, an advantage at home. Many would argue that teams like West Coast and Fremantle also face a disadvantage from accumulating much more travel over the course of a season. Below are results from a model that adds cumulative season travel. It pushes Fremantle and West Coast down in the rankings, and some Victorian teams, including Collingwood, up.
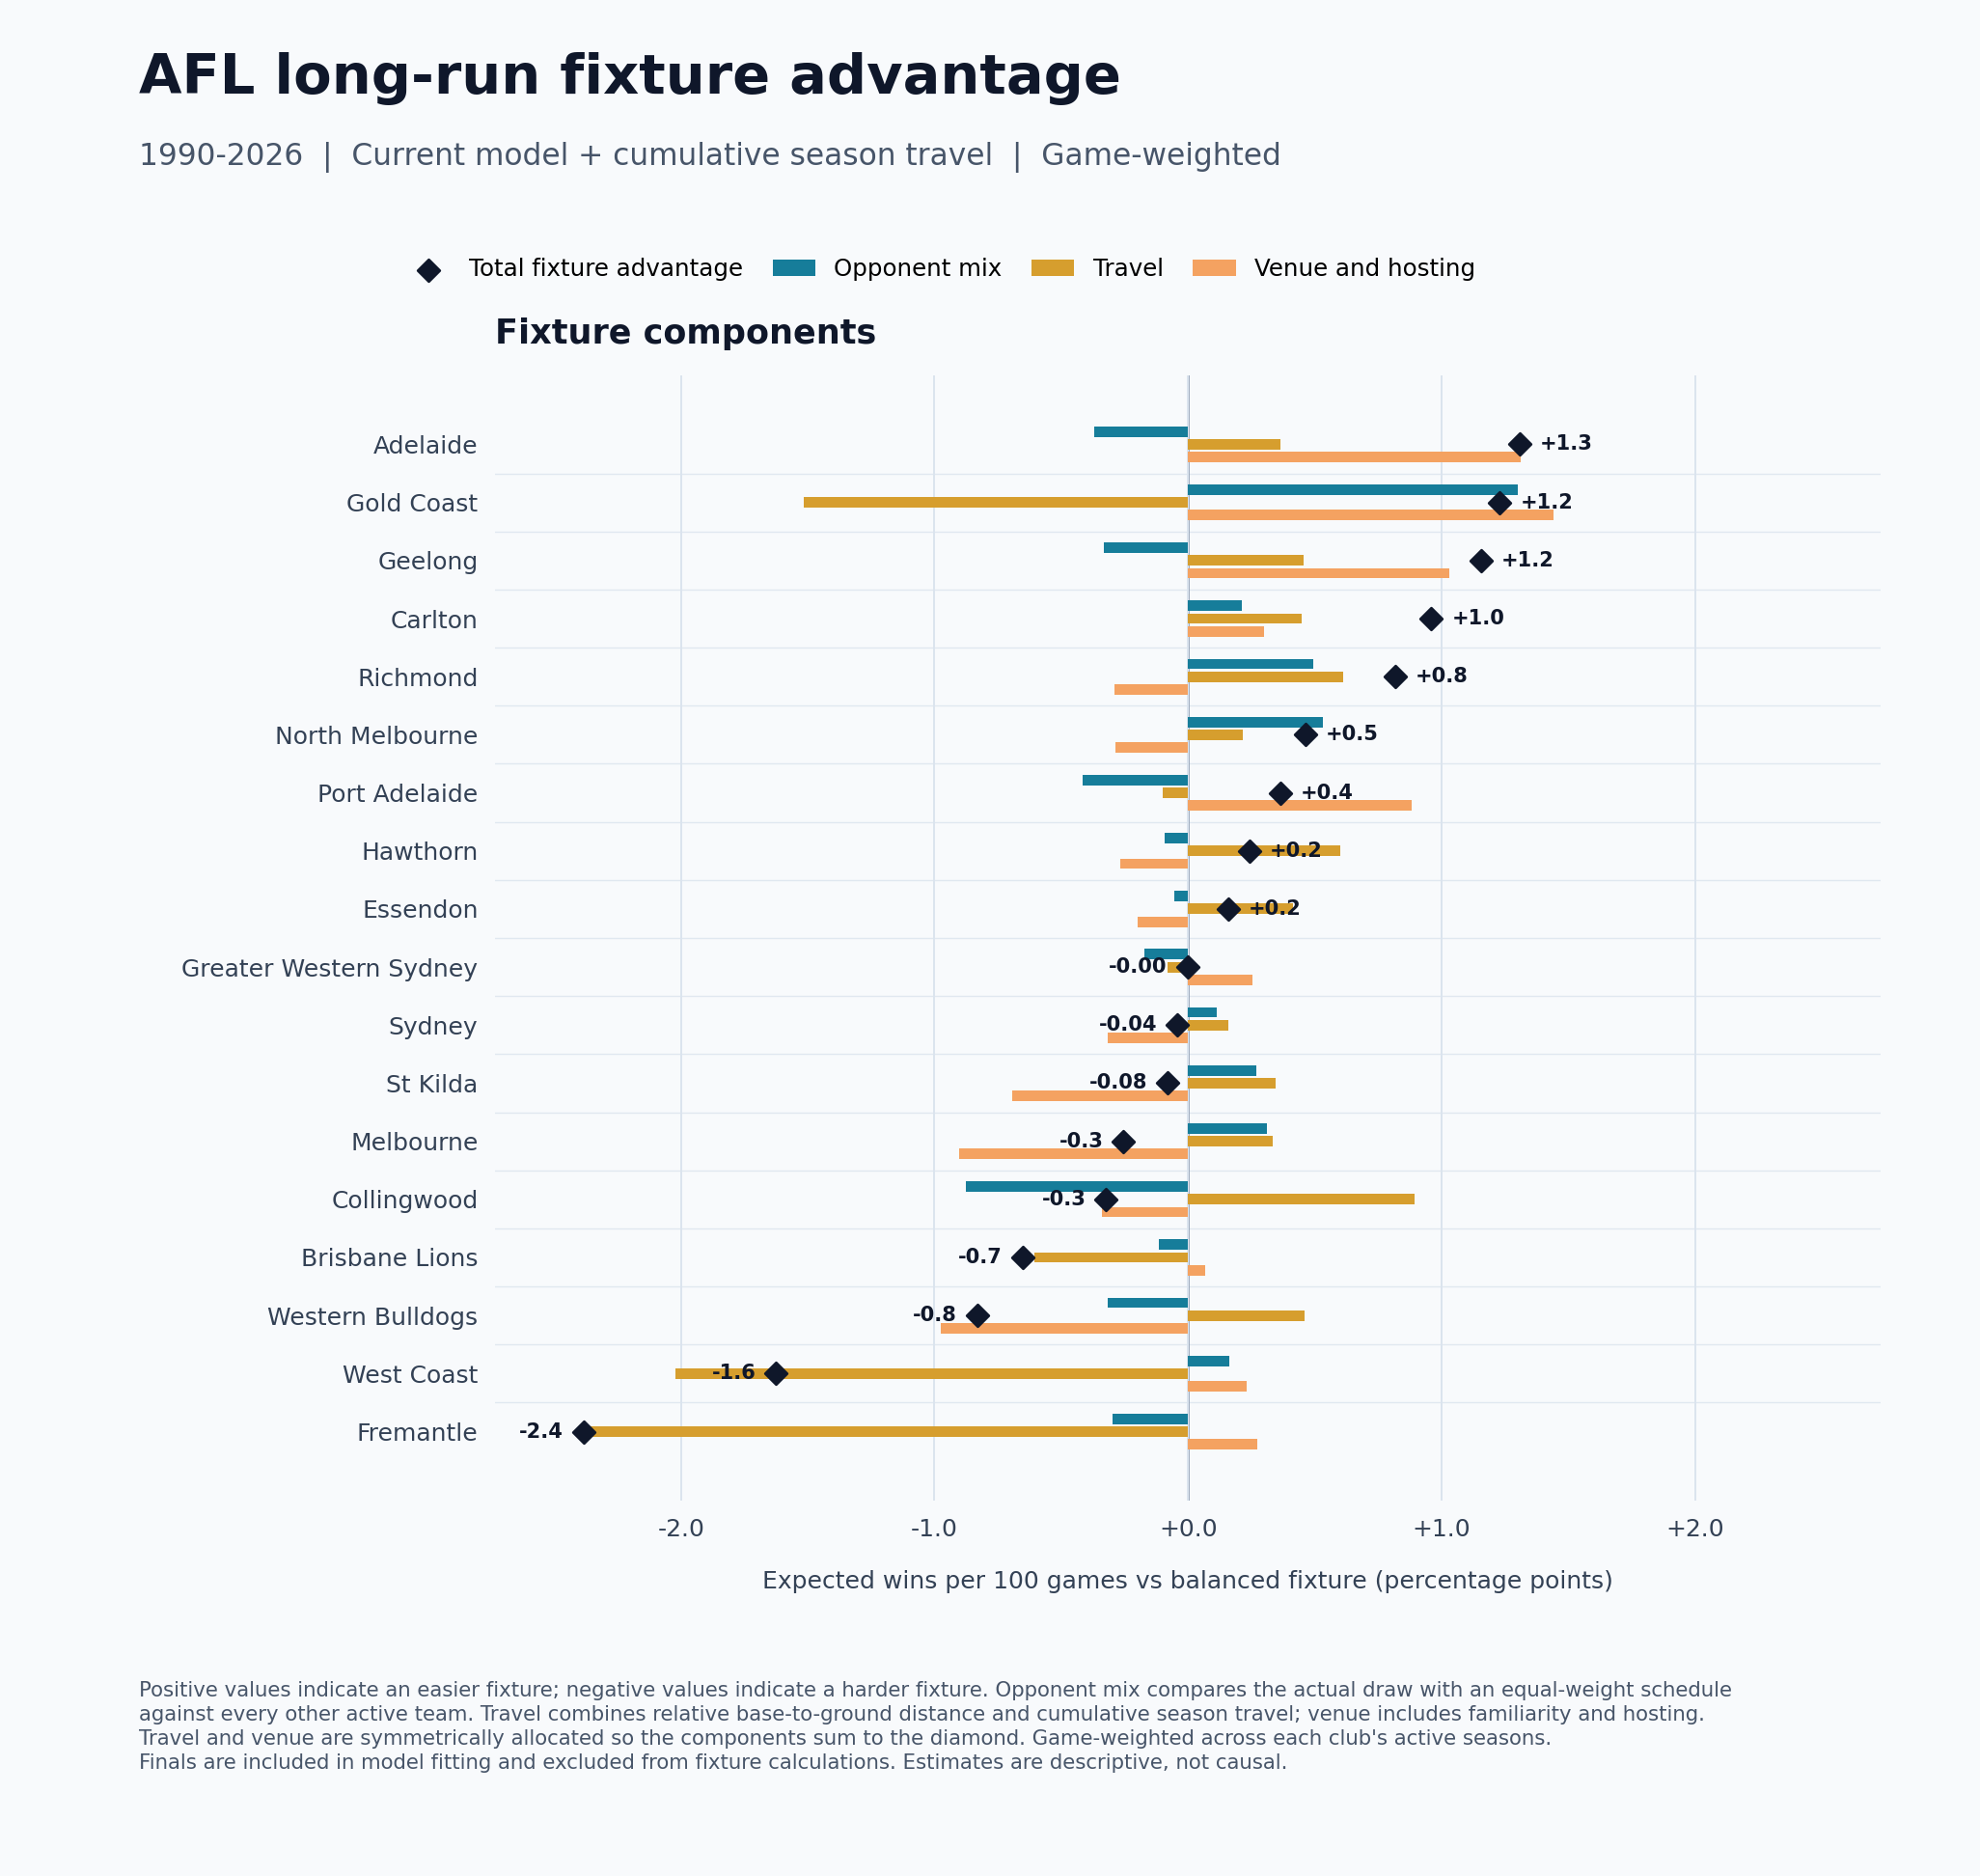
The statistical evidence for a cumulative travel effect is mixed: in some cases the estimated coefficient has the wrong sign, and in testing the model performs worse overall. It’s possible there is a consistent disadvantage from season-long travel that is hard to measure statistically, because long-run travel burden is more or less fixed (and can’t be separated from team strength). For now, we can leave that as an open question.
Now on to 2027
Below is what the model says about fixture advantage or disadvantage for 2027, using 2026 team strengths. As most analyses have suggested, Brisbane have by far the hardest draw (as they should!), while Essendon, Richmond, West Coast and North Melbourne have some of the easiest (as you would expect).
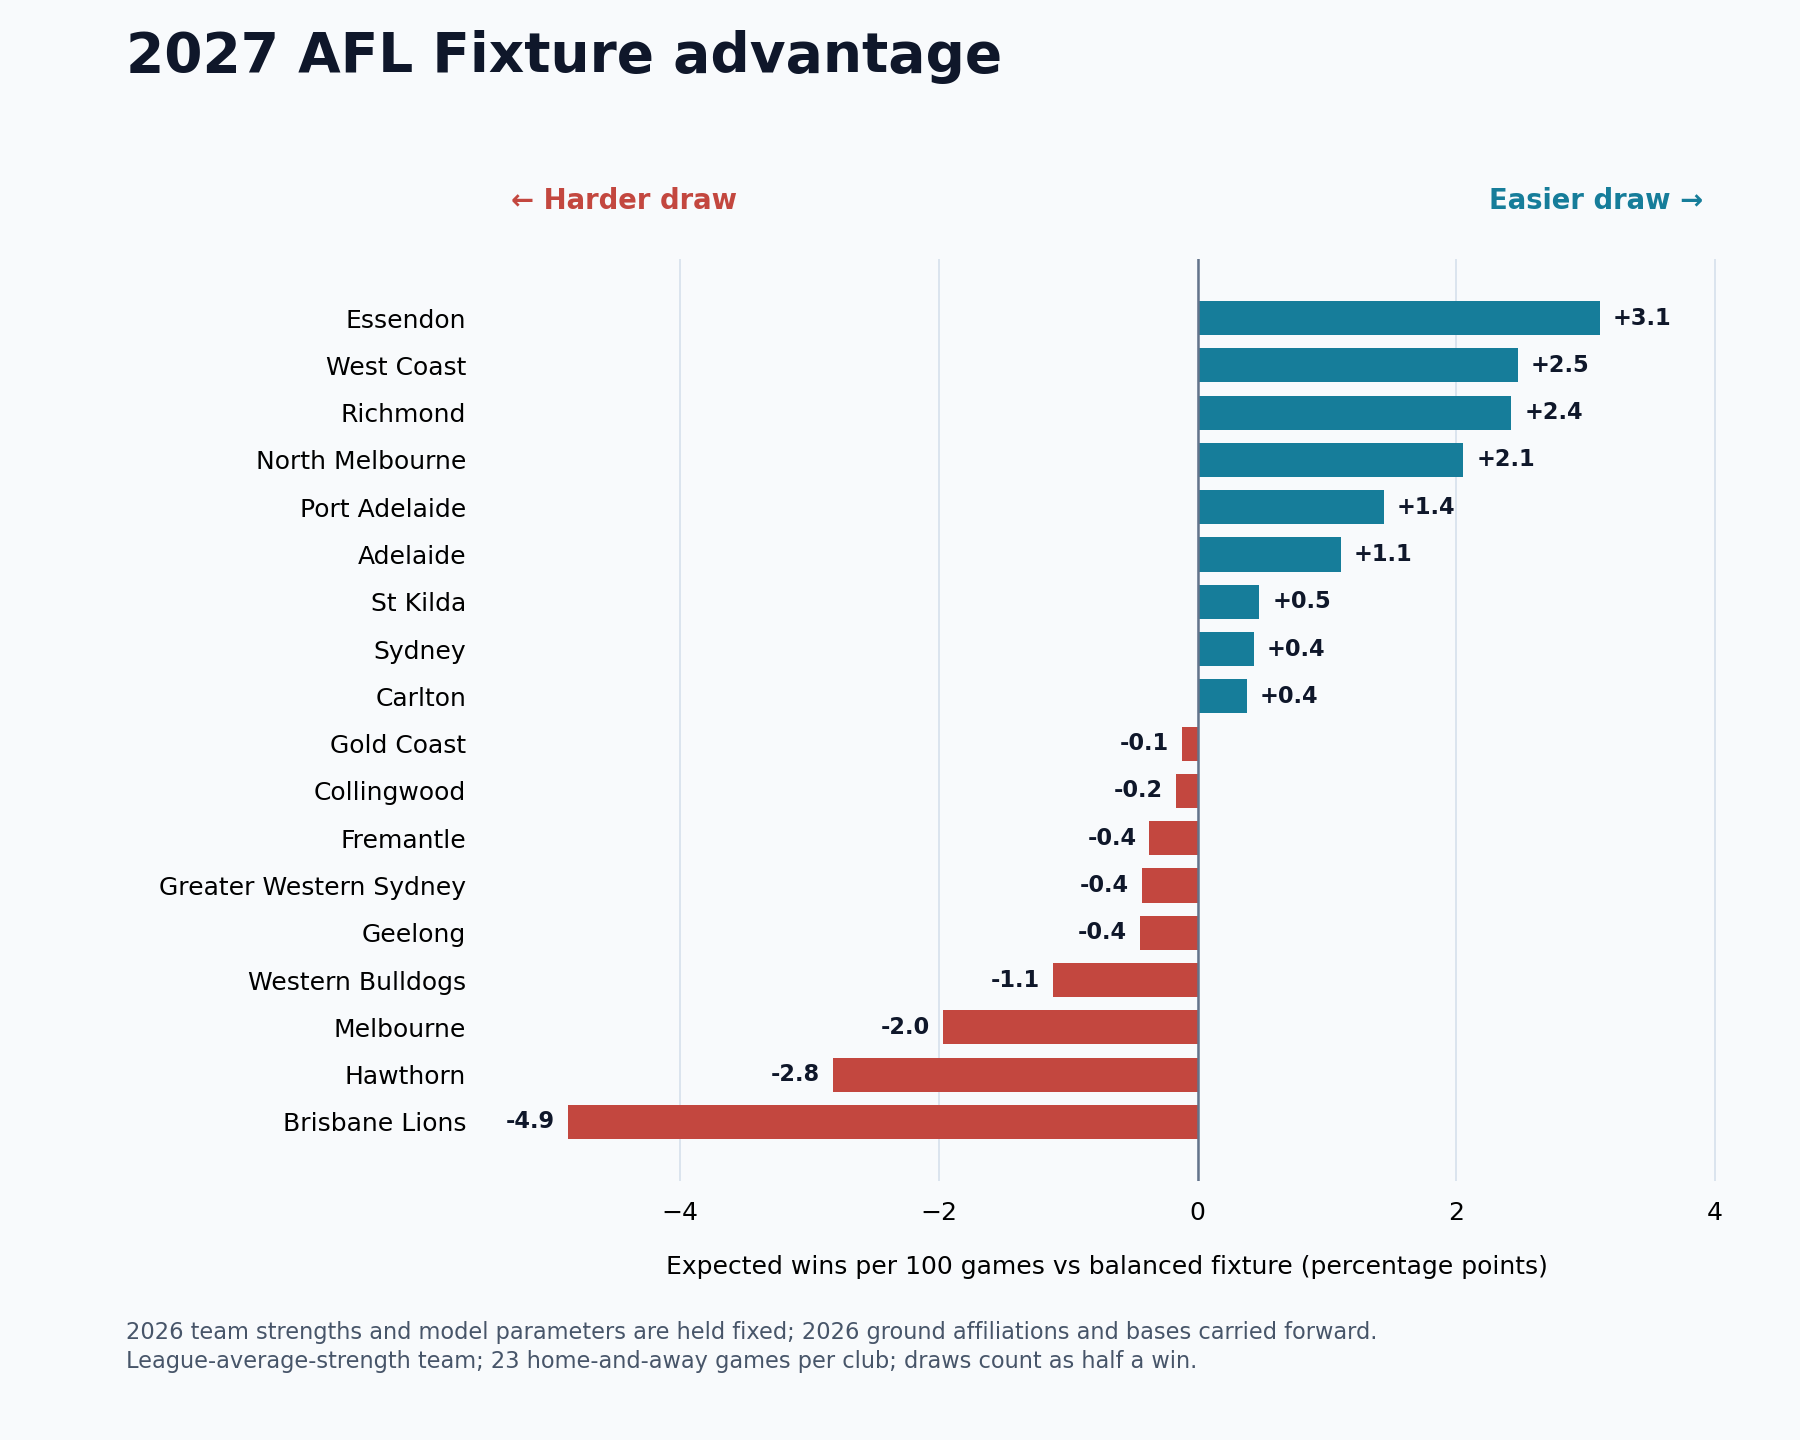
That said, these results differ from some reported in the media, particularly by Fox Footy, and are closer to those of SportPunter. Melbourne have a much harder draw here, partly because they play a home game in Alice Springs. Meanwhile, Collingwood’s fixture is close to neutral. Although the Pies play Essendon and Richmond twice, for their two home games at Docklands they’ve drawn St Kilda and the Bulldogs: the worst possible result for these games.
Fremantle also do better in this list than in some of the media analysis. While they have a tough set of double-up opponents (as you would expect for a grand finalist), they get 13 games in Perth, including away games against West Coast and North Melbourne (note this 2027 calculation does not include cumulative season travel burden).
Of course, this analysis assumes teams perform in 2027 like they did in 2026, which they won’t. But for now, at least, fixture difficulty looks broadly as you would expect based on 2026 performance, with a few differences due to where teams play their home games, including those voluntarily selling home games interstate.